I-Regression a VertexFX client-side indicator
Its free for all trader
I Regression is a powerful Vertex client-side indicator used to calculate and display regression data for a specific chart.
It is used to identify sideways and trending markets using the First degree regression, and the market cycles using the second and third degree
regressions.
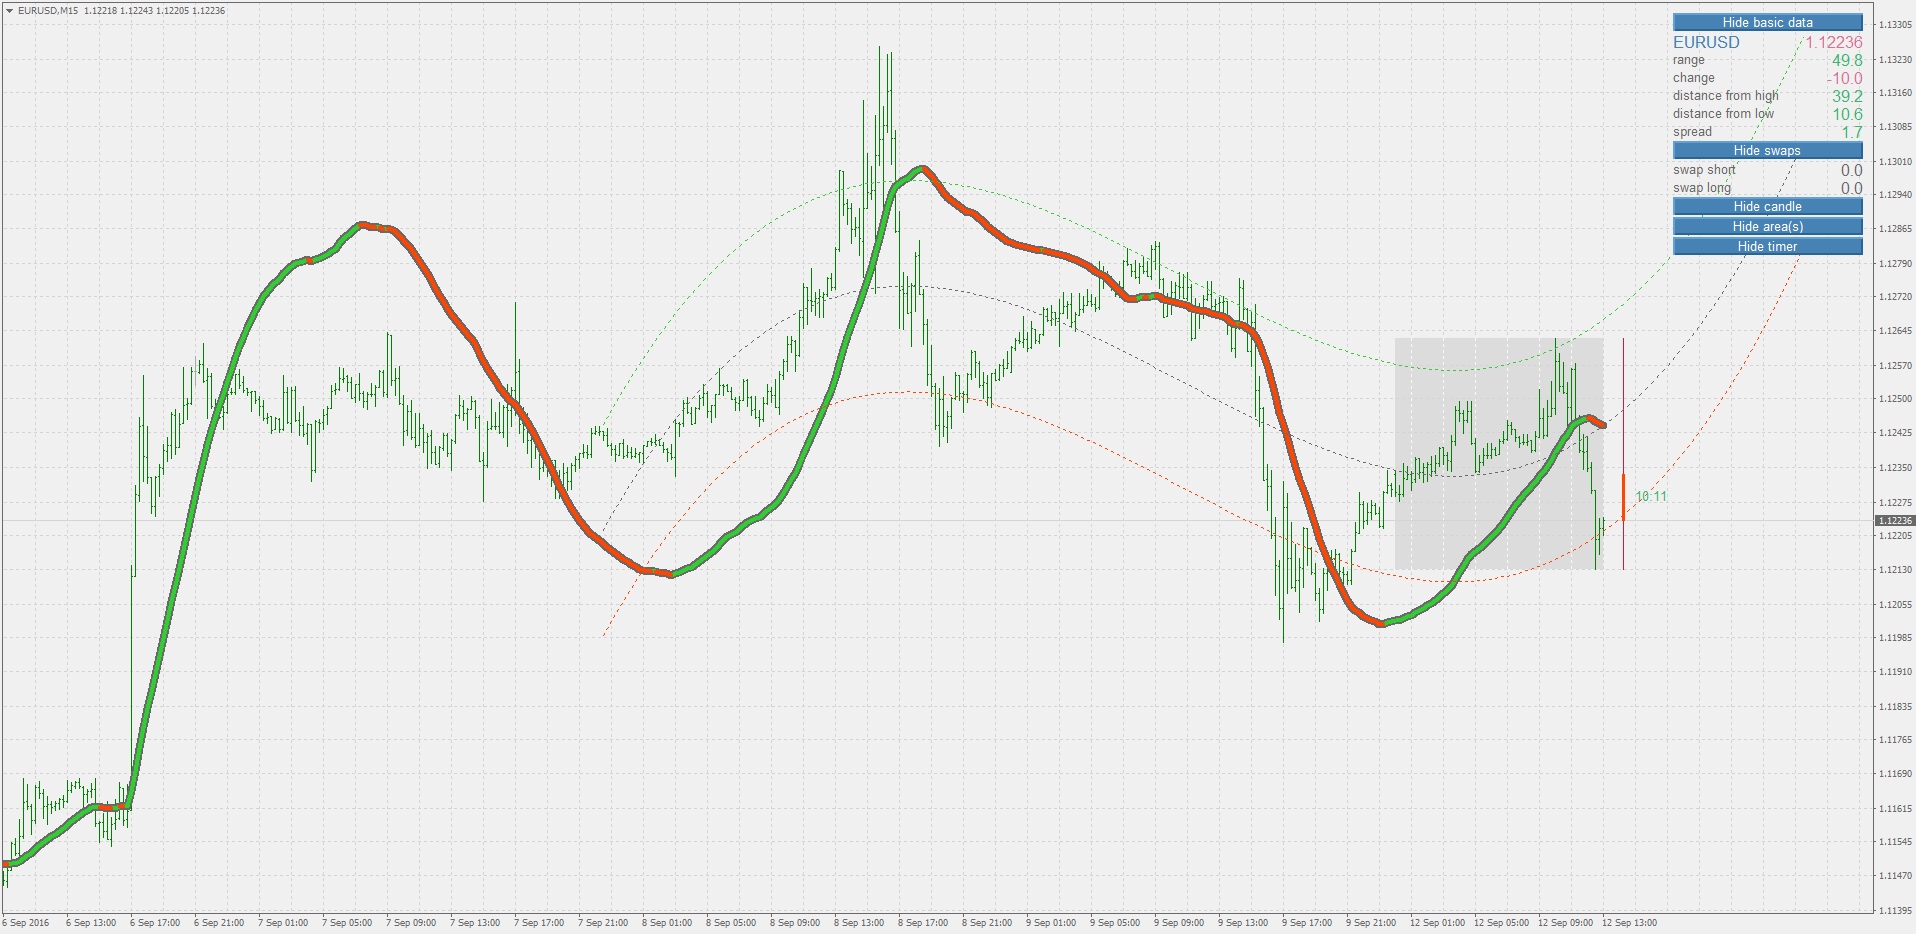
It has three modes of operation, configured based on the DEGREE input parameter –
Number 1 Mode is Linear Regression Mode – As the name implies, it displays three lines, the middle GREEN line which is the linear regression line, a
yellow line each above and below the middle GREEN line. The two YELLOW lines are K S T D times the standard deviation away from the middle
GREEN line. When the prices are restricted within the outside YELLOW lines, it is clearly that volatility is below K S T D number of standard
deviations.
Hence, breakout trades can be placed beyond these two YELLOW lines.
Similarly the Number 2 Mode is Parabolic Regression Mode –The Parabolic Regression Mode is the second degree regression mode using second
power filters to calculate the regression lines instead of first power (linear) regression.
Breakout trades can be placed above and below the YELLOW lines.
Similarly the Number 3 Mode is Polynomial – The Polynomial Regression Mode is the Third degree regression mode using Third power filters to
calculate the regression lines.
Breakout trades can be placed above and below the YELLOW lines.
http://www.hybrid-solutions.com/plugins/client-vtl-plugins/free/i-regr.html
http://omsaitech.co.in/i-regression-a-vertex-client-side-indicator/
Files:
i-Regr.zip
3 kb
SC1.png
24 kb
SC2.png
26 kb
SC3.png
26 kb
- Linear regression channel
- Useful features from KimIV
- Indicators: LinearRegressionLine
omsaitech5551:
Regression is fitted indicator (repaints). You can not use it for breakouts
Its free for all trader
I Regression is a powerful Vertex client-side indicator used to calculate and display regression data for a specific chart.
It is used to identify sideways and trending markets using the First degree regression, and the market cycles using the second and third degree
regressions.
It has three modes of operation, configured based on the DEGREE input parameter –
Number 1 Mode is Linear Regression Mode – As the name implies, it displays three lines, the middle GREEN line which is the linear regression line, a
yellow line each above and below the middle GREEN line. The two YELLOW lines are K S T D times the standard deviation away from the middle
GREEN line. When the prices are restricted within the outside YELLOW lines, it is clearly that volatility is below K S T D number of standard
deviations.
Hence, breakout trades can be placed beyond these two YELLOW lines.
Similarly the Number 2 Mode is Parabolic Regression Mode –The Parabolic Regression Mode is the second degree regression mode using second
power filters to calculate the regression lines instead of first power (linear) regression.
Breakout trades can be placed above and below the YELLOW lines.
Similarly the Number 3 Mode is Polynomial – The Polynomial Regression Mode is the Third degree regression mode using Third power filters to
calculate the regression lines.
Breakout trades can be placed above and below the YELLOW lines.
http://www.hybrid-solutions.com/plugins/client-vtl-plugins/free/i-regr.html
http://omsaitech.co.in/i-regression-a-vertex-client-side-indicator/
nbtrading:
Regression is fitted indicator (repaints). You can not use it for breakouts
Regression is fitted indicator (repaints). You can not use it for breakouts
End-pointed (non-recalculating, non-repainting) version of regression posted here : https://www.mql5.com/en/forum/180002/page60
You are missing trading opportunities:
- Free trading apps
- Over 8,000 signals for copying
- Economic news for exploring financial markets
Registration
Log in
You agree to website policy and terms of use
If you do not have an account, please register