Correlation Trading
After using only the correlation indicators for 2 yrs now, I can honestly say that I have no use for traditional indicators. Overbought/oversold, MA's, divergence indies, Fibo's ,pivots etc all rubbish in my opinion and the reason why 80-90% of traders lose consistently. They all basically tell us the same thing, that a market has been moving a lot or a little in one direction. There is no indicator that can consistently predict short term market movement. My advice is not to follow the herd. If anything fade the traditional signals.
After using only the correlation indicators for 2 yrs now, I can honestly say that I have no use for traditional indicators. Overbought/oversold, MA's, divergence indies, Fibo's ,pivots etc all rubbish in my opinion and the reason why 80-90% of traders lose consistently. They all basically tell us the same thing, that a market has been moving a lot or a little in one direction. There is no indicator that can consistently predict short term market movement. My advice is not to follow the herd. If anything fade the traditional signals.
Aren't correlation indicators almost all based on some of the "rubbish" indicators you are mentioning?
BTW: Short time prediction is not prediction - it is a gambling
That's a great question. The answer is no, our indies track how two separate instruments have traded historically then alert us when they deviate from each other. They do not take into account how far each has moved in either direction or if either issue has reached a magic ratio or projected pivot etc. We only track how they perform against each other. The risk is that they deviate for an extended period of time or forever, which why we trade only the highest correlated instruments, not just those that have recently fallen into correlation. Money management will of course be a factor.
The short term prediction we mentioned is just a phenomenon that we have spotted using our indies but by no means are we suggesting it as a stand alone system, yet:)
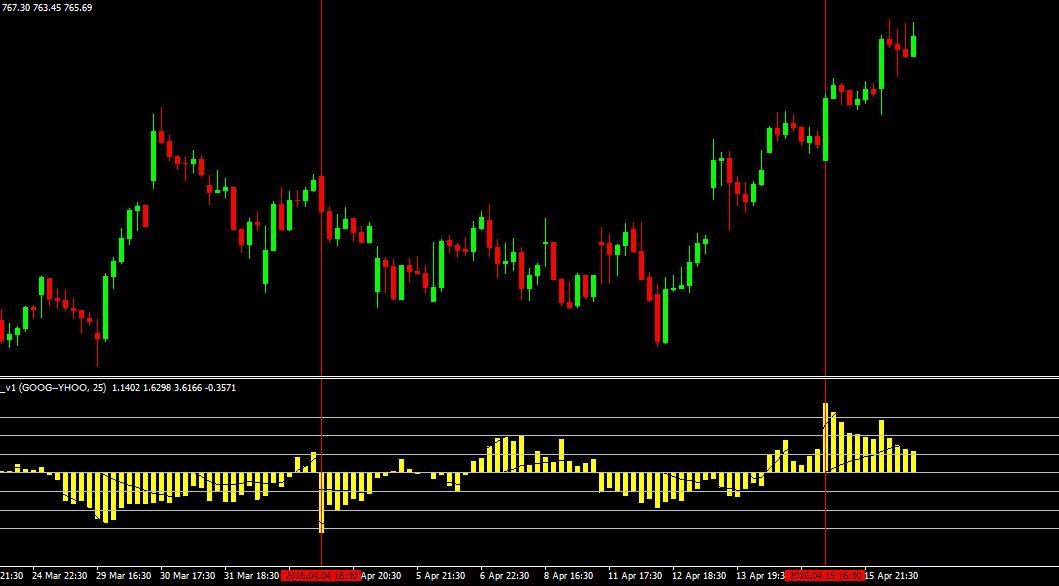
Congrats to our traders who bought Google and sold Yahoo on April 4( red line) and then took profit on April 15(red line). Now we reversed our positions by shorting Google and buying Yahoo. A $1000 in total margin made almost $300 in our first trade and we are looking for the same here
Good Trading!
Trade Alert!
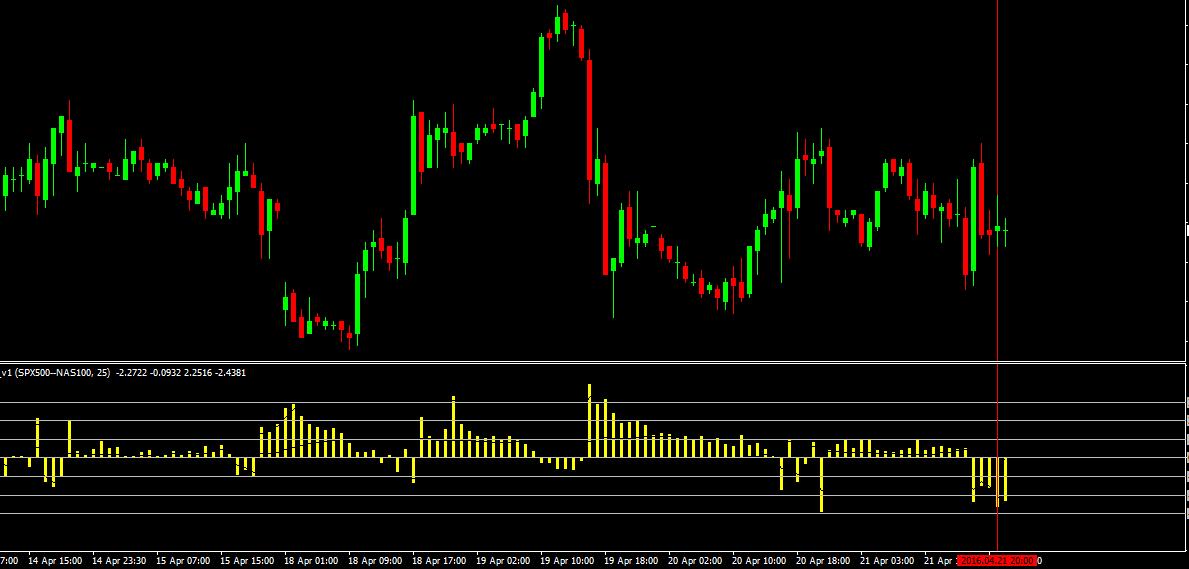
We are sharing an excellent signal that our software just alerted us to. The Sp500 and Nasdaq are trading out of correlation so there is an opportunity to profit by buying the Sp500 and selling the Nasdaq. See Chart.
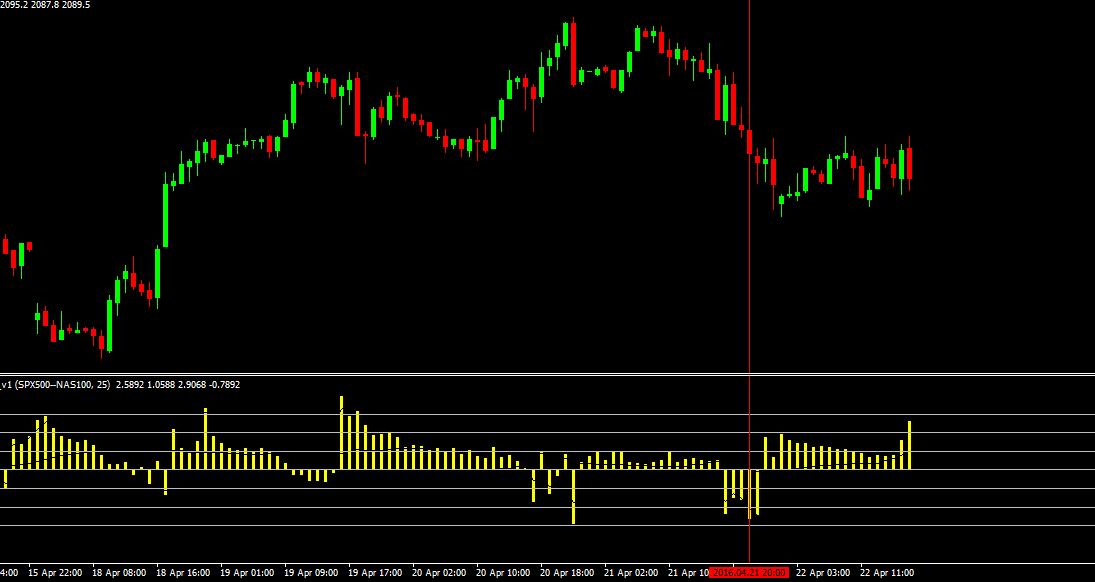
It didn't take long for our trade to show profit and give us an opportunity to re-enter in the opposite direction. We are now short the Sp500 and long the Nasdaq. Profit in 24 hrs= $1200 on $2200 margin.
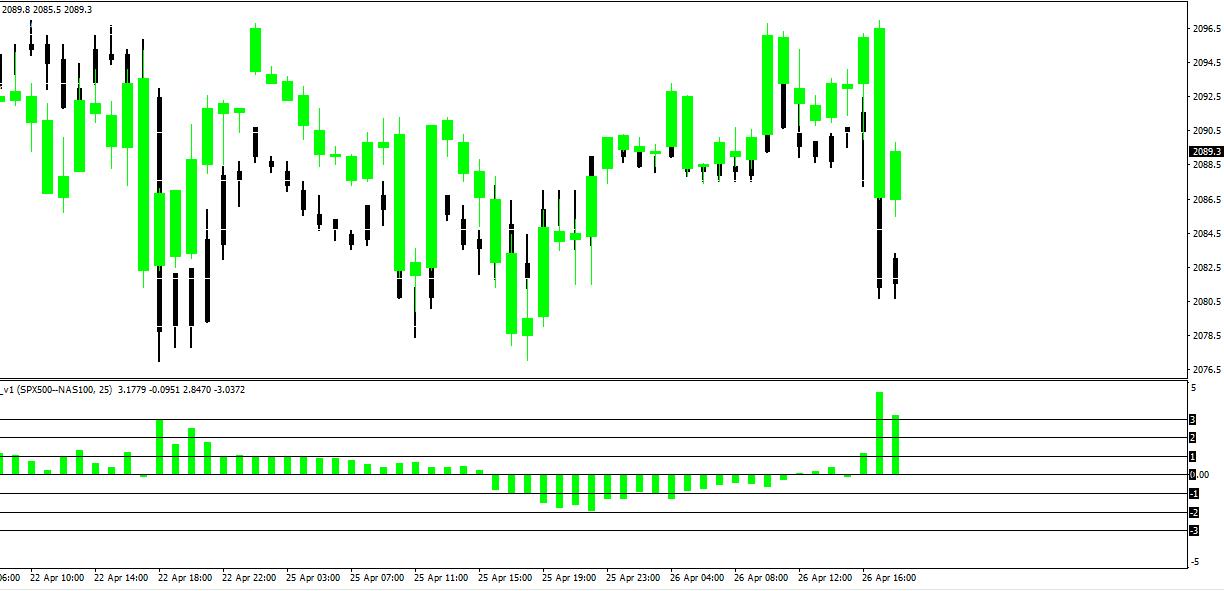
Trade alert! Sp500 and Nasdaq trading out of correlation this morning. Our traders are selling the Sp500 while buying the Nasdaq. Our new charts show the Sp500 is in green and Nasdaq is overlayed on the chart in black.
- Free trading apps
- Over 8,000 signals for copying
- Economic news for exploring financial markets
You agree to website policy and terms of use
I'd like to start a discussion on Correlation Trading Strategies. I came across a set of indicators, one in particular that seems to pinpoint max thresholds of deviation between two highly correlated instruments(see attached chart 1). In terms of which instruments to track, I learned that trading temporary correlation deviations in equity indexes is more efficient than trading forex pairs which may run for weeks before trading back into correlation. I will also demonstrate that another phenomenon occurs when two highly correlated equity indexes trade back into correlation. At the point where maximum deviation occurs, on many occasions there is also a market reversal by one or both of the indexes but on a 5 min. chart. For example, in the 2d attached chart, you can see that short term signals occur when the correlation indicator exceeds 1 ( Sell SP500) and falls below -1(Buy SP500) and there were several successful trades throughout the day.