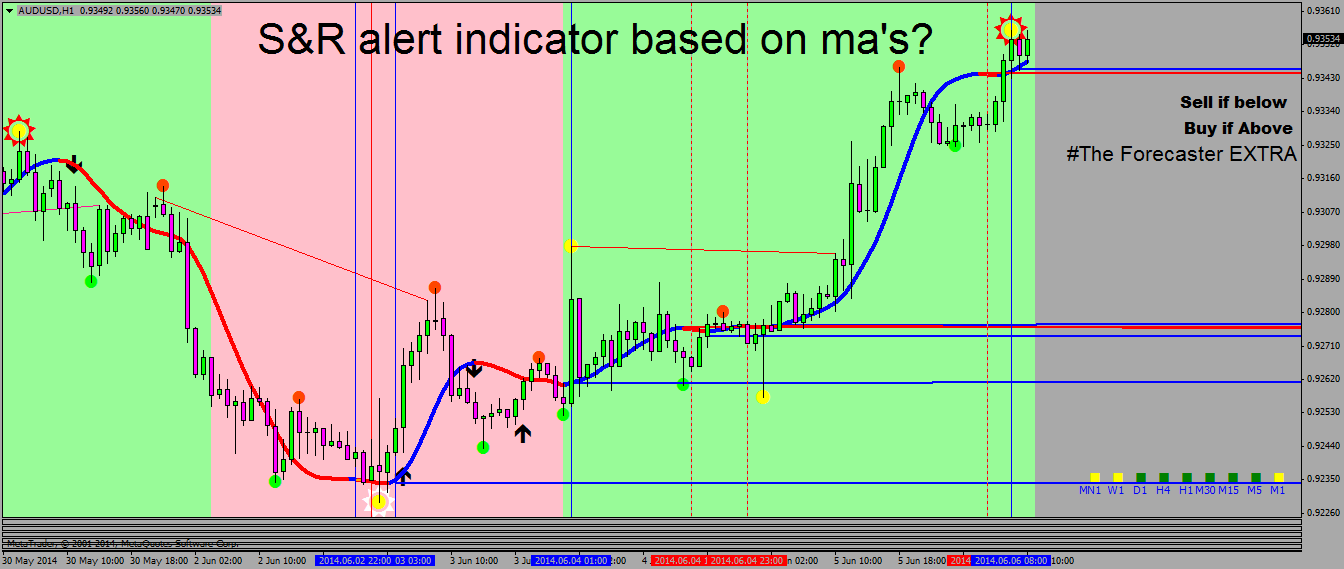
S&R alert indicator based on ma's
Is there any chance of an alert indicator based on the changing direction of a MA or HMA (preferably).
As in the attachment, it would have a support or resistance horizontal 'ray' (with a look back period) and a vertical to show the start point (for visual verification).
Thanks.
TEAMTRADER
TEAMTRADER
Hull from this post : https://www.mql5.com/en/forum/174961/page3 already has alerts on slope direction change
Thanks, I had already looked at the specific thread but I thought it was not covered.
To get something visual (and therefore back checkable) that can give a clear picture of horizontal lines to traders is a far better help.
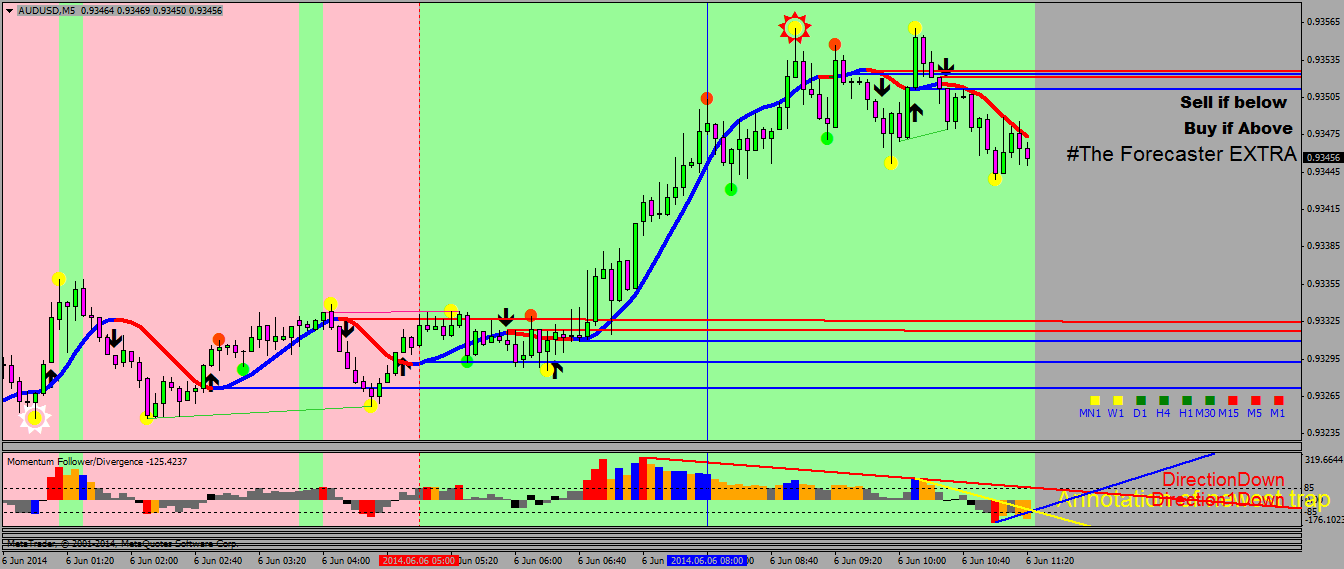
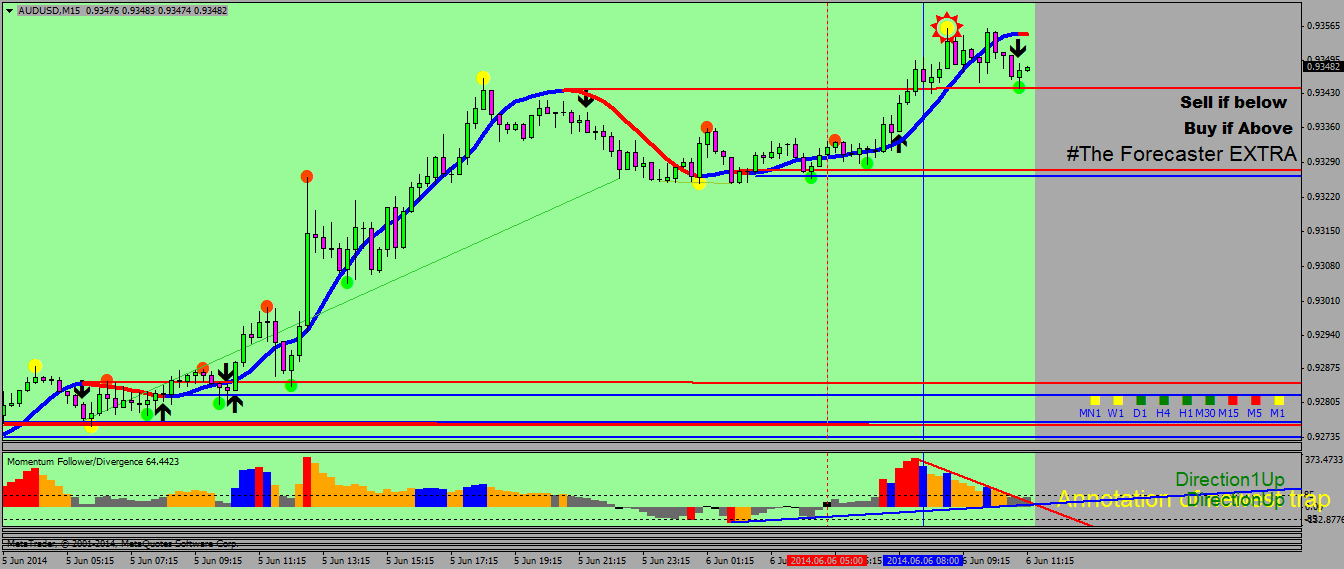
See the 5m and 15m charts I hope to have shown how the trading 'picture' is captured for the next safe move.
Thanks
TEAMTRADER
Would they be valid support and resistance?
Or there would be too many lines?
They would be ma S&R levels. The build up of levels would be controlled by the lookback period.
Visually, a chart with several support levels building under the price with few resistance levels over the price is of great help to assess the current direction and removes the erratic moves of the price.
In essence, to wait patiently for a ma to break a level rather than the price to break a level reduces the amount of bad entries.
See the above illustration in post 3.
TEAMTRADER
They would be ma S&R levels. The build up of levels would be controlled by the lookback period.
Visually, a chart with several support levels building under the price with few resistance levels over the price is of great help to assess the current direction and removes the erratic moves of the price.
In essence, to wait patiently for a ma to break a level rather than the price to break a level reduces the amount of bad entries.
See the above illustration in post 3.
TEAMTRADERPosted a hull moving average 2 with a possibility of drawing those SR lines here : https://www.mql5.com/en/forum/174961/page14
They would be ma S&R levels. The build up of levels would be controlled by the lookback period.
Visually, a chart with several support levels building under the price with few resistance levels over the price is of great help to assess the current direction and removes the erratic moves of the price.
In essence, to wait patiently for a ma to break a level rather than the price to break a level reduces the amount of bad entries.
See the above illustration in post 3.
TEAMTRADERWill try that way. Thanks for the explanation
They would be ma S&R levels. The build up of levels would be controlled by the lookback period.
Visually, a chart with several support levels building under the price with few resistance levels over the price is of great help to assess the current direction and removes the erratic moves of the price.
In essence, to wait patiently for a ma to break a level rather than the price to break a level reduces the amount of bad entries.
See the above illustration in post 3.
TEAMTRADERSeems logical
Magic, thank you again MLaden.
I will test this thoroughly as it is exactly what is needed for safer scalping.
TEAMTRADER
I like this indicator
There seems to be a fault on the attached indicator - could someone look at it and fix it please?
It is always the penultimate support or resistance that is not 100% - it fires sometimes but not always.
In the illustration the resistance line is not shown and is marked in thick black where it should be.
Thanks
TEAMTRADER
- Free trading apps
- Over 8,000 signals for copying
- Economic news for exploring financial markets
You agree to website policy and terms of use
Is there any chance of an alert indicator based on the changing direction of a MA or HMA (preferably).
As in the attachment, it would have a support or resistance horizontal 'ray' (with a look back period) and a vertical to show the start point (for visual verification).
Thanks.
TEAMTRADER