Live analyzing charts everyday + Ichimoku Winners ebook - page 3
You are missing trading opportunities:
- Free trading apps
- Over 8,000 signals for copying
- Economic news for exploring financial markets
Registration
Log in
You agree to website policy and terms of use
If you do not have an account, please register
GBP CHF Daily chart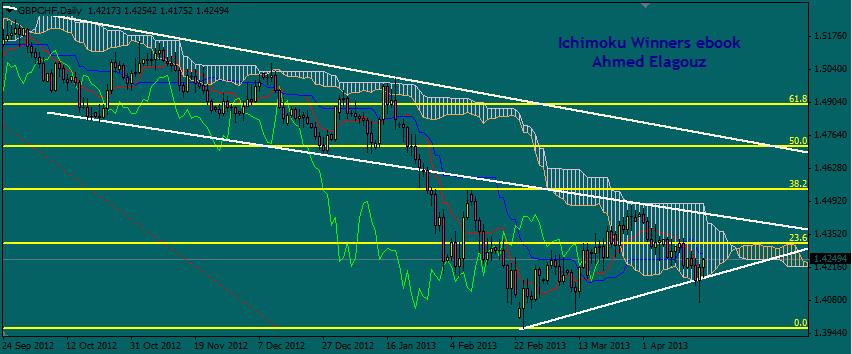
Still didn't break the clouds and the trend line.
Looking for signals to buy on the small time frames after breaking 23.6 Fibo line.
EUR USD Daily chart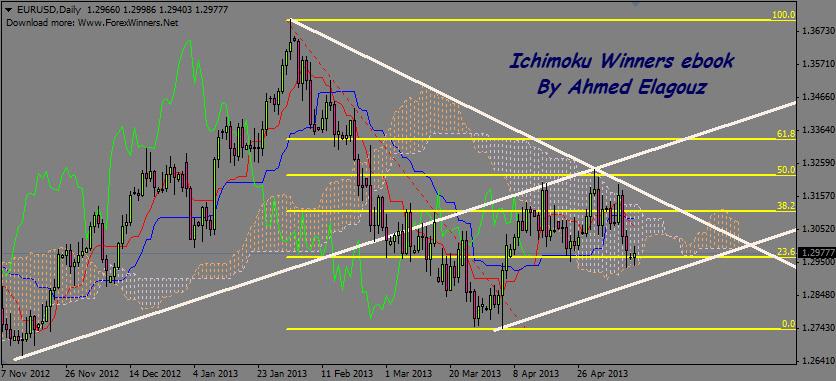
An important support area.
GBP JPY H4 time frameWill search for shorting signals on the small time frames after breaking the trend-line and crossing the Tenkan-sen for the Kijun-sen.
EUR USD Daily chart.Strong Resistance area on the daily chart. The price crossed above the Kumo ( 2013/5/30 ) , but still couldn't break the trend line.
any news ahmed? how are your results overall?
USD JPY / Daily chart
Tools : Ichimoku Indicator - Trend lines - Fibonacci Retracement
Strong Resistance
Area on the Daily chart. The price is touching the Clouds and the trend line.
ORbreaking the trend line to go up through the clouds.Looking for catching shorting trades after closing the price under 23.6 Fibo.
any news ahmed? how are your results overall?
hello , man
everything is great (Y)
GBP JPY H4 chartTools : Ichimoku indicator , 2 trend lines , Fibonacci Retracement.
Important trend line on GBP JPY.
Looking for breaking the trend line and the Fibo level to continue moving up , Or going back to touch the clouds.
NZD USD Daily Chart
Strong resistance area on the daily chart and closing a red candle under the 38.2 Fibo line.
Looking for going down to touch the flat Kijun Sun and the 23.6 Fibo line.
Important Trend line after breaking the clouds and 23.6 Fibo line.
Looking for breaking the trend line going to 38.2 Fibo
ORtouching the trend line and go back up near the clouds.[URL="http://forexwinners.net/wp-content/uploads/2013/08/USD-JPY-Daily-chart-ichimoku-clouds-trading.jpg"