You are missing trading opportunities:
- Free trading apps
- Over 8,000 signals for copying
- Economic news for exploring financial markets
Registration
Log in
You agree to website policy and terms of use
If you do not have an account, please register
First lets find a destination of price
First lets find a good probability of (destination of price).
and identify where some hidden resistance that may exist.
so we will start from the top.
i drew the yearly candles first. then drew some trend lines.
this shot gives traders a perspective of over all direction and trouble spots.
the direction is long. so we want to know how far we will go long before running into resistance
that actually has some punch to it.
after we identify it is safe for more room to go long before running into trouble then we can set our
sites on staying long until we get to a trouble spot.
the first step is to see how much room we have. in this shot you will see yearly resistance lines
that will be trouble later on.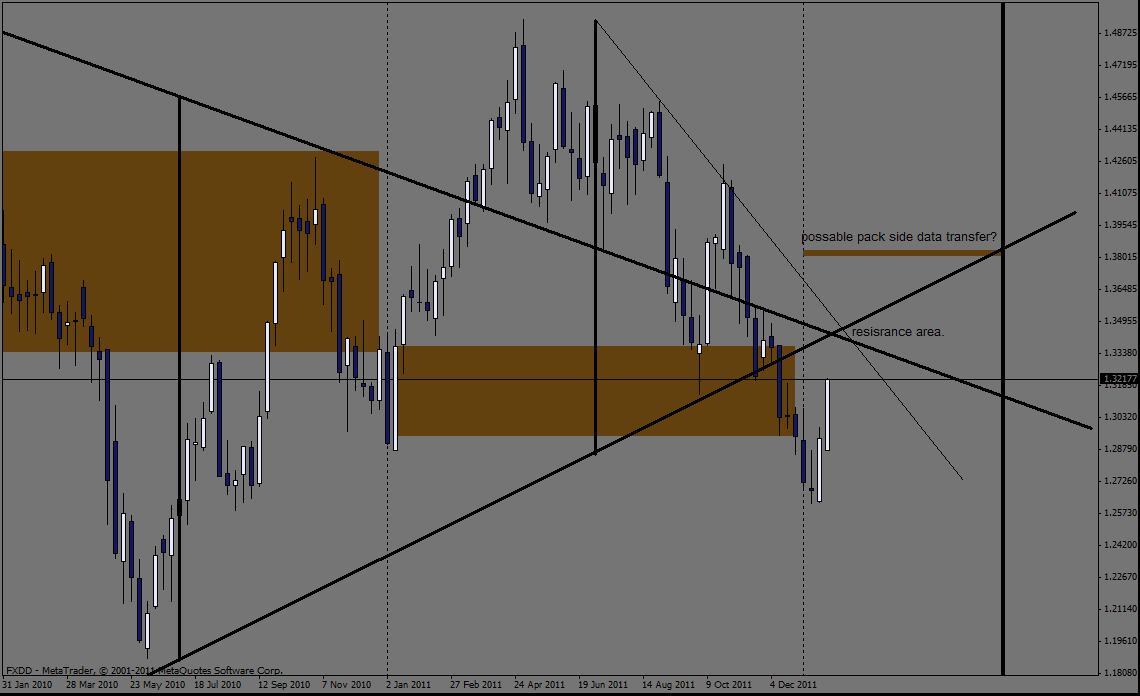
next we will look at the up momentum progress, and talk about what to expect there.
i have to go to work
i will be back in a few hours.
ok i msde it home
i am tired. though so lets make this short and sweet.
we are near a new monthly open. after two strong weeks and with a new monthly open..
we will get a fall off on the target side of the weekly time frame.
that means we are looking at a weekly spinning top.
our goal is to get into the bottom of the range that is going to develop. with this spinning top, and go long again.
so we have to identify the range of this spinning top as best as possible.
sell at the top and buy at the bottom.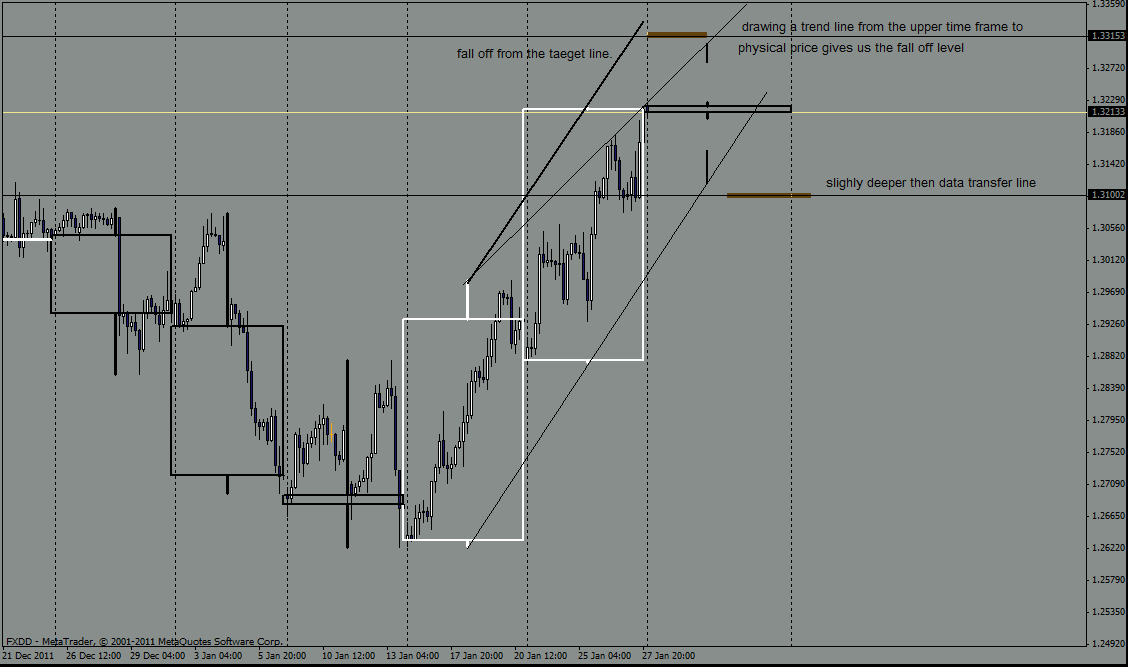
the reasoning is: we are starting a new week after two strong weeks, this is where you get a fall off candle..
this candle will also be a channel shift. that we will look at next week.
i need rest.
My support is my previous target 1.3203.. Above here will go up to next one @ 1.3291.. Will check others in morning..
i learned my lesson
the lesson i learned is: to include the other possibility where risk could be taken.
this possibility is where we do not reach the third point in the trend line and go long.
this is when the physical channel actually is an x trade to the up side!
so be aware there is another point to take a risk.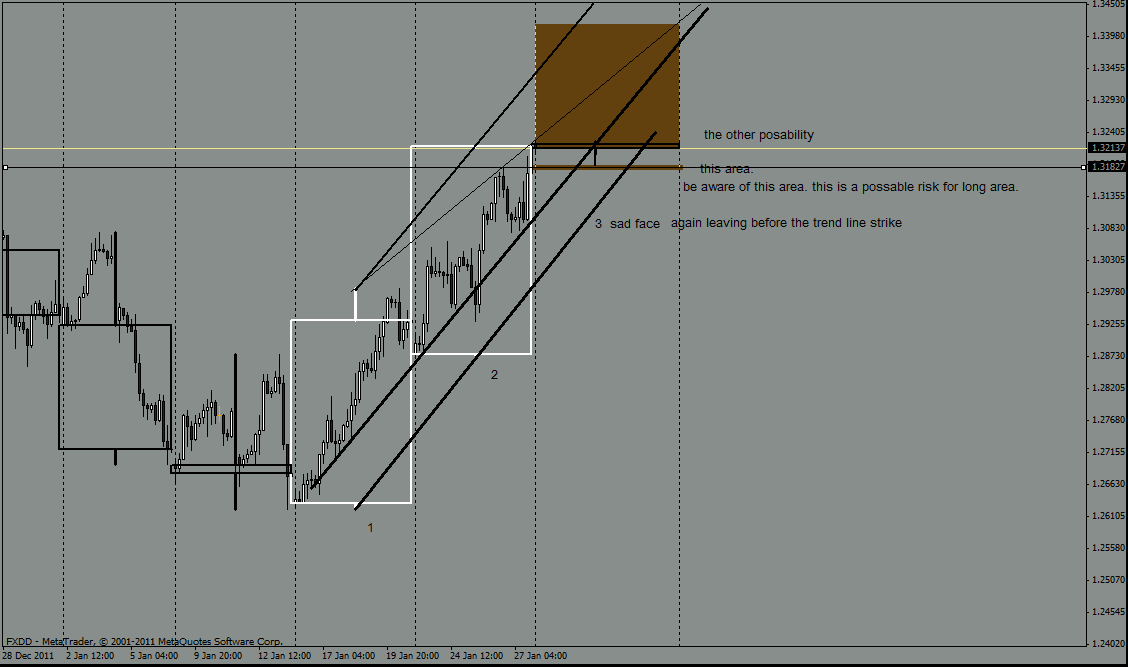
the lesson i learned is: to include the other possibility where risk could be taken.
this possibility is where we do not reach the third point in the trend line and go long.
this is when the physical channel actually is an x trade to the up side!
so be aware there is another point to take a risk.Boe i still am struggling to see what is different in your picture here and mine below which is the same concept, a trendline.. Can you tell me what the difference is please.. will be appreciated of course.
sure
what i was using the trend line for is to roughly track the channel. so i wanted the most amount
of strikes on the channel line as possible, and forget any over shots.
so with physical price am looking for weakness, by tracking the physical channel. because i know a shift in this
physical channel will lead to ranging and counter trending.
and at the bottom of ranging market in a up trend is where you want to enter.
so if you do get in at the bottom outside the channel, you want to see an X=trade, or re-enter the channel.
now what to watch out for is when you do not re=enter the channel. and get a channel shift. that means
you will continue to range and price will attack your entry, 90 to 101% . so the over shot you placed your
line on was a x-trade., over shot. which does not define the channel ,but can define short lived swing before
a channel shift.
i hope that helps? let me know.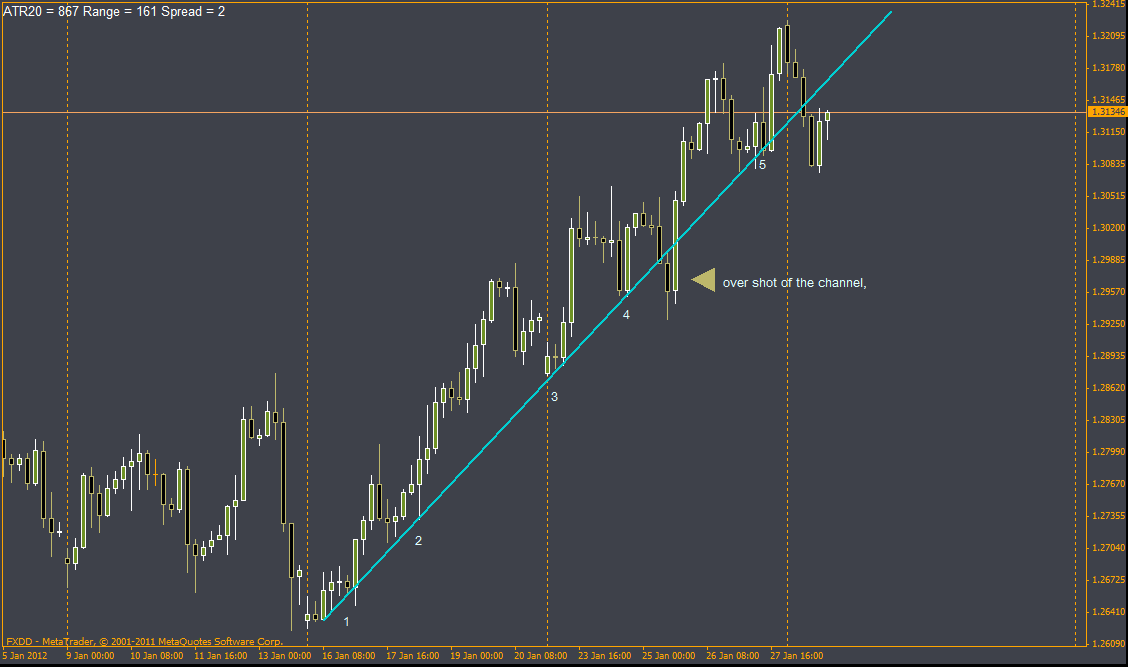
ok
so what want to see is another x trade here. if we just slide up on this line that means more ranging
and in most cases that continued range will come and get your entry point from this afternoon.
so that is why we want this to climb back into the channel. we want the range at this level to be done with.
and let it range over your head later on. the more times we cross this line the less likely it will be an x trade.
the x-trade is powerful thing i have taught here. traders are taught thees line after being broken are resistance
and they can be eventually.
traders learn early on... do not buy into resistance. that's what keeps traders from buying just when the market
explodes.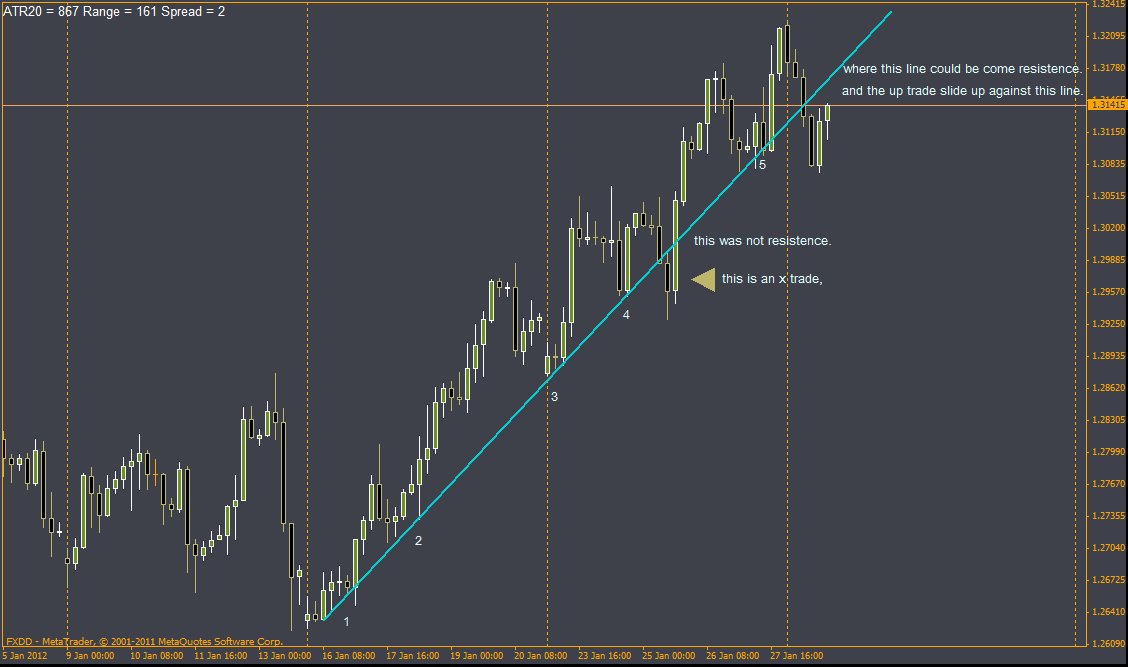
could you state the curr pair eg. eur/usd and the TF -- time frame of your dig
could you give analysis on EUR/AUD -- I wanna to make a splash entry, when I enter, I always wish to be RIGHT after first 1/3 to 1/2 day, easier this way, rather than speculate , and hedge the side that I am wrong -- so much fuss when I have to handle possible losses
xx
xx i just got back from dealing with going back to work again tonight. i will have to look at your request tomorrow.
i need sleep!