Advanced trading lessons - page 6
You are missing trading opportunities:
- Free trading apps
- Over 8,000 signals for copying
- Economic news for exploring financial markets
Registration
Log in
You agree to website policy and terms of use
If you do not have an account, please register
one candle range.
not all candles are created = . in fact in trend rarely are candles the same size in range!!
an average range is way more useful if categorized by the type of candle.
1. trending candle range!!
2. doji bar range!!
3. inside doji bar range!!
note: dojie bar is all bars except trending bars on the scale. example spinning top , pin bars, also dojies
all measured in this category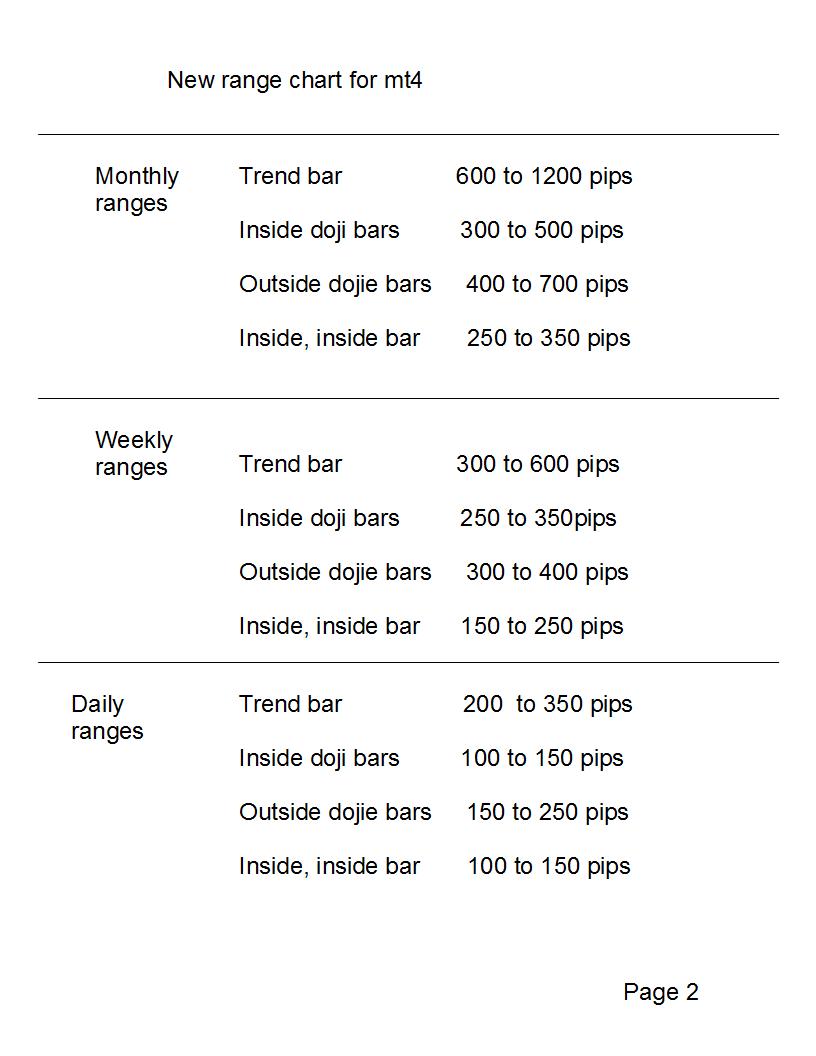 !!
!!
now you have much more accurate look at ranges.
the next thing we will see.
i am going to take some shots of the market and talk about range of over lapped candles.
what a trader should look for in that trend turned ranging over lapped tail of the next time period.
lets start with a monthly trending candle. you the trader believes there will be a back to back trending
candle, but you are not sure how to get onto that trade. you do not know when to trust the market!!
so many times you may have tried but ended up with loss only to watch the market trend continue.
lets put all that into the past!! so the shots i am taking will have explanations on them.
ok we are starting with a monthly trend candle , and we want get onto the next monthly trending candle.
but from the daily frequency!!!!!!!!!!!!!!!!!!!!!!!!!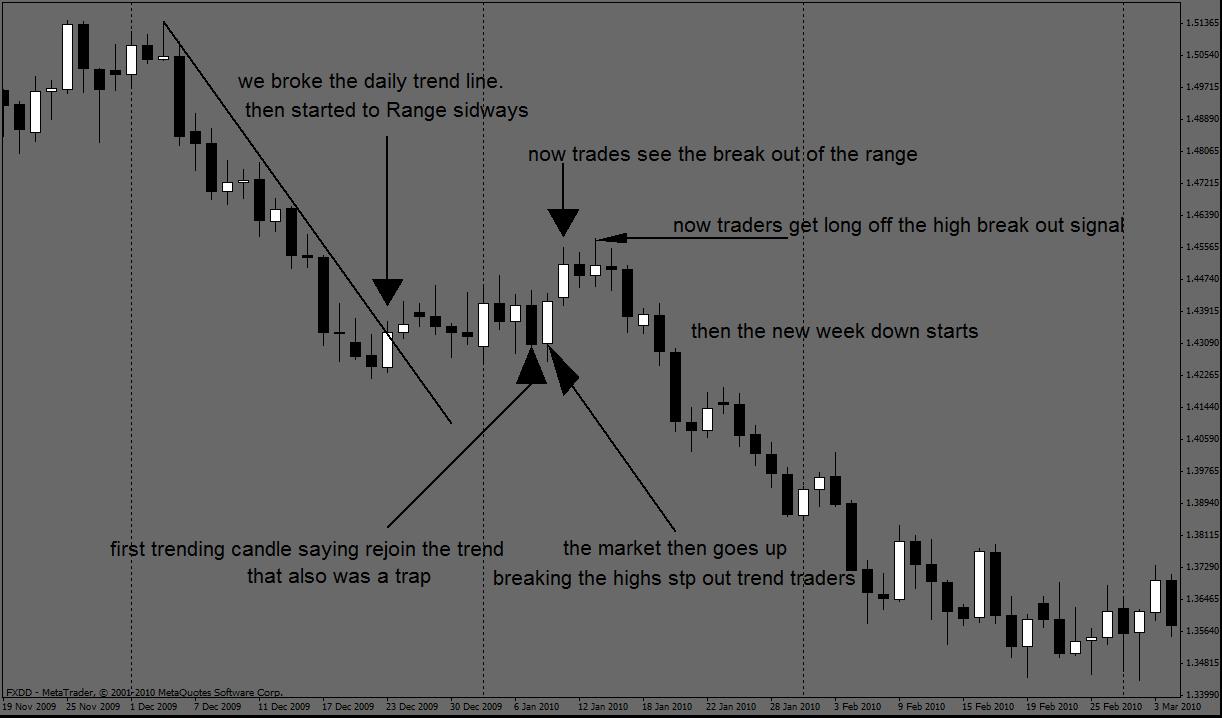
now you may ask whats this have to do with our rang subject, you will see.
not only should you be looking for the traped traders
not only should you be looking for trapped traders in the tails on overlapped candles.
but if you are expecting back to back trending candles on the monthly, you should
be only be looking at 150 to 230 pips from the close of the last trending candle in range.
but with out a good trap, i do not trust it!!
now looking at the chart
looking at the chart the first thing that should stand out is this:
a monthly out side dojie bars range is: just a little larger than a weekly trending bar!!
a weekly out side dojie bars range is: just a little larger than a daily trending bar!!
this tells you right away about 1 1/3 4 hr against a weekly trend, is all you should
expect when weekly trend slows down.
this tells you 1 1/3 days against a monthly trend, is all you should expect when a monthly
trend slows down.
this is just the beginning... their is a lot more to learn about ranges, but having a good idea
of what to expect is good start!!
ok faze one ranges done.
now remember 99.9% of all candles over lap to some degree. thats what we will learn next.
ok
so on the weekly, the trap should be shown, on the four hour time frame.
and the range about 1 1/3 of 4 hr candle from the close of the previous week.
75 pips to 115 pips counter trending against the close.
the risk reward ratio is risking 40 pips for around 1000 pips on the monthly set up.
the risk reward ratio is risking 25 pips for about 375 pips on the weekly.
now you know what to expect where to take risk, and when.
lots of traders talk about 3 to one risk reward. this is much better ratio. so you can be wrong
10 times on every monthly chance, hit once, and still make 600 pips. that's pretty good. i guarantee
you will not be wrong ten times in a row.
but this is just another place to take risks.
a lot about trading they say is excepting losses, that's not true!! that's a disaster waiting to happen.
trading is about taking losses when you know 100% of the time you will win more then you loose
and win bigger then you loose. so losses are nothing more then extremely educated strategic moves
that you know will work most of the time, but not always.That's All!!
but you have to be to say this to your self. i did this years ago. i will not forget it. i looked at potion of my account and said to myself, lets do some math.
so i did the math. the math was not how much i was willing to risk on each trade, but rather how much was i willing to loose in my account total before i got a win. and would that win erase my total losses.
this is how you learn to pull the trigger my friends, this is how you put to the test what you have learned!!
i want to say, being ready to face that loosing over all is not an option, but loosing some times is ok
if you know what you did was planed and statically sound. then you know your on your way in trading.
you will not be wrong ten times in a row besides!!
the other thing is
how many years have i herd traders say do not pick tops and bottoms.
off of a weekly or monthly trending candle i may do short near the beginning
of the next week.or month..
why would i risk a 200 pip stop on that monthly trade?
why wouldn't i try and pick out a top on lower freq.to join the next's months candle?
it would be foolish not try and pick a top on down move. it's foolishness talking
about not picking tops and bottoms, as long as you are with a higher freq. momentum.
i do it all the time kind of gutsy, but i have tight stops. risk reward threw the roof.
besides having 2 or three lots on a trade and being down 180 pips will kill ya. i have been there
and i haven't been back there in long time. i usually risk 25 pips at a time. that's pretty tight
for forex.
going short i look for a trap, usually two freq. down from my decision time frame. at the beginning, very middle, and ends of that time frame.
now i have to go at least 3 time frames down from the decision time frame in between the beginning and middle, and middle and end.
and what i am looking for to get on board is: Trend line break, trending candle against the trend, pin bar against the trend. or combination of the two. then i will go short above the highs on the trending candle
and short almost immediately on pin bars. some times above pin bar highs.
getting in on or near or below the time frames middle i take profit near the close. but getting in on the
top in the tail of large time frame like the monthly i will ride and ride.
ok enough of that
now lets say you think this
you think the next month will be doji bar, lets say a spinning top. an outside bar spinning top.
well you then change your mind set. spinning tops do not happen after a newer strong close
unless it is a trap on the freq. you are on. or after a mature run then a strong close!!
the newer the better when thinking trending candle to trending candle.
so in other words if you get into a trade trying to go from trending to trending and its a new
fresh trend be aware!!
that means take profit now, and try and get back onto the trade at near or above some previous high when gong short.
i always use short examples as trend to avoid confusion.
i will talk about price action later for know ranges
price action and psychology of trading later!!
for now spinning tops.
spinning top closes on the freq. your on!!!!! that most likely means that the trap is not lower
but on your frequency!! so if your range will change instantly. go to your range chart
for the freq. you are on and divide your range in half and that's about the range from previous,
close you should get. put a line in where that is then lower your freq, by three look for the trap
on or near the line.
be aware if the trap is pin bar on the freq. your on just take it now!! with a wider stop then usual.
let me go to the chart and find some examples.
most likely i will do this tomorrow, though it's late.
when we look at spinning tops
spinning tops range over lap is different from trending candle to trending candle.
spinning tops range overlap!!!
90% of closed spinning top is challenged often.
110% of the range of spinning tops range are challenged more than often!!!!
160% of a spinning tops range is challenged often.
what is a spinning top???????????
A SPINNING TOP IS TRAP THAT A CURED ON LOWER TIME FRAME!!!! 90% OF THE TIME!!!!!
THAT'S WHAT SPINNING TOPS ARE!!!!!! SO NOW WHEN YOU SEE ONE CLOSED ON A CHART
YOU KNOW A TRAP HAPPENED ON A LOWER FREQUENCY TIME FRAME!!!!
Spinning tops continue
Now when a spinning top closes on the freq. You are on you want to know
when the trend will continue!!!!!
Well 70% of the time the trap you are looking for when a spinning top closes
is: The time frame the spinning top just closed on, but not always, some times
it's one or two below.
But there is always, always a trap after a spinning top closes, before the trend will
continue!!!!!
Traps after spinning top closes:
#1. Trend candle against the trend,then slightly breaking the high, down trend will
continue, timing perfect.more about this latter!
#2. Spinning top against the trend breaking the high down trend continues.
#3 combination of the two above.
#4 a defined range of several spinning tops with a pin bar with trend that broke
the highs of all of them, the down trend will continue.