A simple system that uses Speculative Sentiment Index (SSI) data?
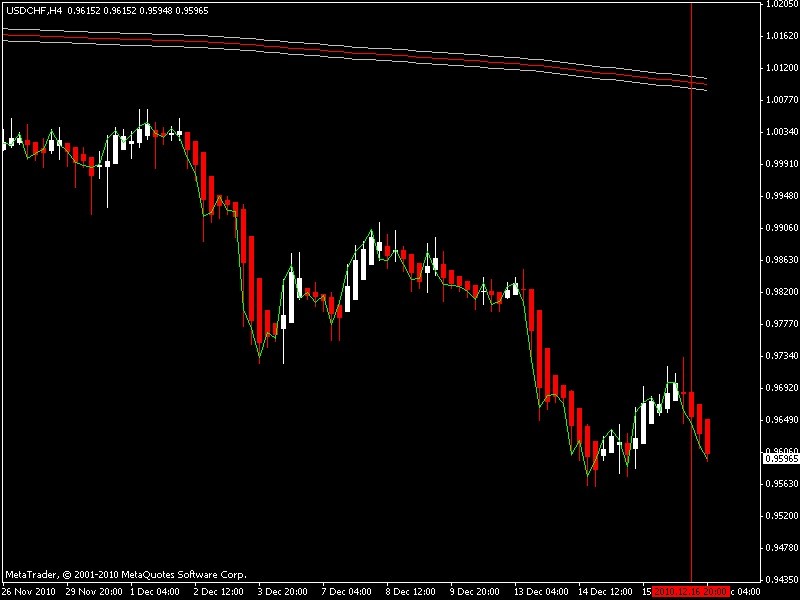
USD/CHF is also heavily biased to the down side at 3.44. It too is in a down trend. The Heiken Ashi also gave a sell signal several hours ago that would have netted a nice profit.
Files:
ssi_trigger.jpg
75 kb
You are missing trading opportunities:
- Free trading apps
- Over 8,000 signals for copying
- Economic news for exploring financial markets
Registration
Log in
You agree to website policy and terms of use
If you do not have an account, please register
I searched for this but couldn't find anything. What about a system that uses Speculative Sentiment Index data? My particular source is from FXCM, but I'm sure other brokers offer this data. Basically, the SSI data shows whether their clients are short or long heavy a particular currency pair. It is a contrairiian indicator.
A quick primer:
Right now, USD/CAD has a reading of 4.76 to the buying side. That means that for every one seller at FXCM, there are almost 5 buyers. If you look at the USD/CAD, you will see that it is in a down trend. Why are people buying into a down trend?
It's because most traders are noobs who don't know what they are doing.
There is case after case showing that if you plot the SSI data agains't the actual chart over time, you will see a relationship between a high SSI reading, and the price moving strongly in the other direction.
For instance, what SSI is saying about USD/CAD is that the price will likely move down strongly soon. (it is right now, actually. A strong Heiken Ashi sell signal on the H4 signal went off a few hours ago that so would have been very profitable)
So my question is, what kind of trigger can we use to capitalize on this? I've looked at Renko charting with emphasis on support/resistance breaks, and that looks pretty good.
The other obvious candidate is Heiken Ashi on H4 time frame with a long moving average as a filter. Any other ideas? Thoughts? Differing points of view?
EDIT:
Important note:
SSI data can not be used to help make scalping decisions. The data only comes into play on the H1, H4, daily and weekly charts.