You are missing trading opportunities:
- Free trading apps
- Over 8,000 signals for copying
- Economic news for exploring financial markets
Registration
Log in
You agree to website policy and terms of use
If you do not have an account, please register
That is a Bollinger bands stop(deviations set to 2) made as histogram
One more renamed. Why am I not surprised?
Anyone know indicators in the Picture ?
Anyone know indicators in the Picture ?
The lower looks like a simple case of multi time frame indicators - 3 instances in one sub-window (without values on the right side, if I had to guess, the yellow line is simply a price, and the 2 other values are some multi time frame indicator applied to that same price)
The upper : I don't know. Could be anything
Is someone able to tell what are those indis? First have no idea, second someone guessed WPR and third should be RSI but level 100 haven't seen RSI could reach that level.
Is someone able to tell what are those indis? First have no idea, second someone guessed WPR and third should be RSI but level 100 haven't seen RSI could reach that level.
The lowest is almost sure one of the indicators from the ocean series
The lower looks like a simple case of multi time frame indicators - 3 instances in one sub-window (without values on the right side, if I had to guess, the yellow line is simply a price, and the 2 other values are some multi time frame indicator applied to that same price) The upper : I don't know. Could be anything
Thank you... Thank's a lot...
Hello mladen, hi guys.
I'm looking for an EA wich has in comment "JP_GRID V1.0" plus the TF used (M5, M15, H4, etc..). I saw it in this myfxbook page Contest - guilhermecarva System by guilhermecarva | Myfxbook , but i cannot find which is...
Does somebody know this EA?
Hello
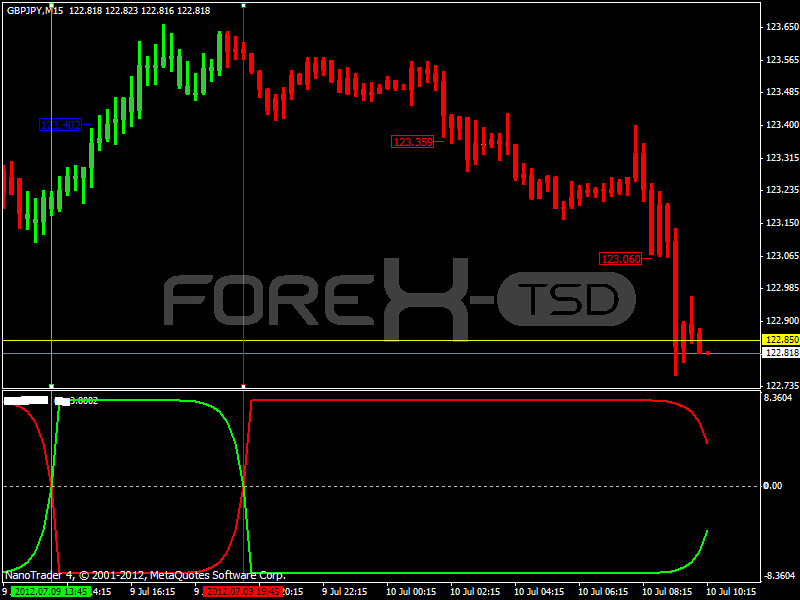
does anyone know about this indicator ??
Hello does anyone know about this indicator ??
Looks like a repainting indicator
Looks like a repainting indicator
It is ....... forget about it