You are missing trading opportunities:
- Free trading apps
- Over 8,000 signals for copying
- Economic news for exploring financial markets
Registration
Log in
You agree to website policy and terms of use
If you do not have an account, please register
X0 and rsi filter
Hello Mladen, Can You Please Make These MetaTrader4 Indicators To MetaTrader5.
Thanks In Advance.
vichal
It is not an off-line chart
It is writing data to a file (any file) and the using that data from an indicator that is reading that same file (a simple txt file). So it has nothing in common with regular charts. Format of it is a format that the author decided to use for that example and is not a format of a ".hc" file (which is the history file in metatrader 5) Using that format (from that indicator) is not standardized and can not be used in any other indicator, script or EA that is not specifically written for that format invented only for the purpose of that indicator.
As I said, they did not release the format of metatrader 5 data and they (judging from their menus) are not planing to do that neither do they plan to have offline (custom) charts in the future (it seems that their paranoia reached maximum so now they are disabling any custom charts and custom data handling)
Hope this clarifies it a bit. Those are indicators that should display tick data in an indicator, not on chart and they can not be treated the same way as a regular chart
regards
Mladen
Creating Tick Indicators in MQL
Creating Tick Indicators in MQL5 - MQL5 Articles
Here is the metatrader 5 version of rsi filter
PS: just saw that you are using period 7 for rsi, and must admit that it is much better than the default 14 (for others see the comparison of the upper 14 and the lower 7) so changed the code too : now it has default 7 for rsi period.
Hello Mladen, Can You Please Make These MetaTrader4 Indicators To MetaTrader5.
Thanks In Advance.
Klinger Volume Oscillator
hello,
today i was searching for the klinger volume oscillator (kvo).
i found 3 different indicators using 3 different calculations.
could please somebody tell me which one is using the correct formula, if one of them is correct? ;-)
here is the formula: Positive Territory, Inc. : Klinger Volume Oscillator
thank you very much an best regards,
mk77ch
it seems that there are many different formulas existing...
http://www.iqbroker.com/technical-indicators/klinger-volume-oscillator.aspx?id=Indicator_1456
http://trader.online.pl/ELZ/t-i-Klinger_Volume_Oscillator.html
http://www.enricomalverti.com/index.php?option=com_content&view=article&id=25%3Ail-klinger-volume-oscillator&catid=3%3Aarticoli&Itemid=12&lang=it
http://user42.tuxfamily.org/chart/manual/Klinger-Volume-Oscillator.html
According to that definition and some other definitions I have found, it would be kvo2.
Attaching a version that I have and which is solving a case when current and previous price are equal (if and when it happens, it is the case which they describe at that link as the "In our research, we found no statement as to how to treat the case") as a continuation of previous "trend", so that even that case is solved in more or less acceptable manner (at least I hope so)
regards
Mladen
hello,
today i was searching for the klinger volume oscillator (kvo).
i found 3 different indicators using 3 different calculations.
could please somebody tell me which one is using the correct formula, if one of them is correct? ;-)
here is the formula: Positive Territory, Inc. : Klinger Volume Oscillator
thank you very much an best regards,
mk77chThis became an interesting problem in the end ...
Attaching 2 versions in order to show what is happening when built in standard deviation on array calculation is used and what should it be like when a real standard deviation on that same array is calculated. The built in one is simply ignoring price changes in price array that are made in order to fix the price of the bar currently used in calculation to open.
So, do not change anything in the array or you are going to get results that you are actually not looking for . It makes me wonder how the rest of the "on array" built in functions work ... Nothing new when it comes to metatrader functions, one might say
Anyway, the one without the "(not OK)" in the name is working as it should. It can easily be checked - use open price (1) for calculation and then the delayed and the non-delayed version must be the same, otherwise they must be different. To remind, delayed does not calculate on open price but on ppppppO set of prices : so it uses open price only as the last price assuming that that is the price that was valid for any price at the open of the bar.
Here is a comparison of the delayed (upper) and non-delayed (lower)
regards
Mladen
hello Mladen, can you please make a delayed version of the attached indicator?
Thank you!
Thank you very much!
Best Regards,
mk77ch
Hello mladen
Good evening mladen.
Can you adding zero cross arrows on this indicator?
thanks!
Req) One More Average MACD Filter
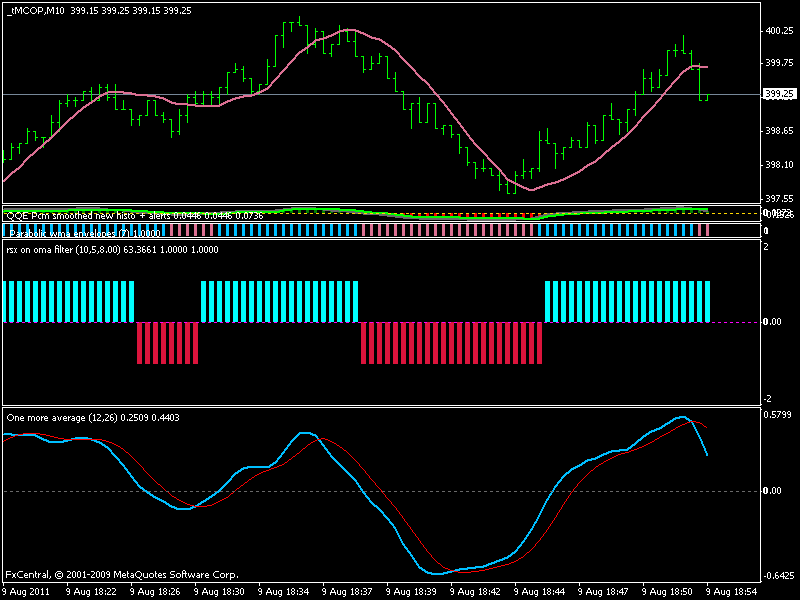
Hello Mladen, Can You Please Make IndicatorOne More Average MACD Modify To One More Average MACD Filter. Like Shown In The Image macd_-_std_normalized_1_1_histo.mq4 Rsx On Oma Filter.
Thanks In Advance.
yama
Here you go
regards
Mladen
Good evening mladen.
Can you adding zero cross arrows on this indicator?
thanks!