You are missing trading opportunities:
- Free trading apps
- Over 8,000 signals for copying
- Economic news for exploring financial markets
Registration
Log in
You agree to website policy and terms of use
If you do not have an account, please register
Sorry, but where to put that code snippet?
Thanks. Post 120, page 8
Not a version like that
Dll less correlation indicator (it has the Pearson and Spearman rank (auto)correlation now, not just Spearman). Also possibility to have fixed levels added (which can be useful in some cases). Set of available prices is also upgraded to have all the recent price types
Dll less correlation indicator (it has the Pearson and Spearman rank (auto)correlation now, not just Spearman). Also possibility to have fixed levels added (which can be useful in some cases). Set of available prices is also upgraded to have all the recent price types
Will the regular version (correlation to other symbols) be available too?
sebastianK
Yes, it will be available :)
sebastianK
Yes, it will be available :)
Here is a version with on option to limit how many pivot lines to display
As of yearly pivots: the indicator supports pivots for time frames supported by metatrader 5.
mladen:
PIVOT lines mq5
https://c.forex-tsd.com/forum/67/pivot_points.mq5
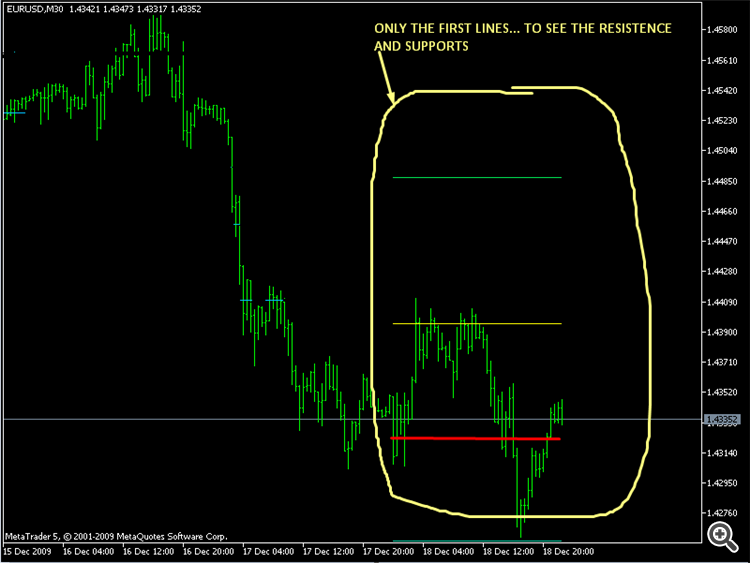
Is it possible to make this component have a option that enables to draw only the "first" pivot, resistences and supports...
sometimes this is very usefull to keep the graphic more clean and visible and I don't need more periods
for example

[X] PLOT ONLY THE FIRST LINES
==========================================
Pivot points
Slowly preparing the rest of indicators normally found on metatrader 4
__________________________
Pivot points for metatrader 5
Since parameters are descriptive now (new feature of metatrader 5) just an explanation what does "Hide connecting lines between periods" do. This indicator is drawn as indicator buffers and not objects. hence when period changes, it will draw a "connecting line" between two periods like on this picture :
When "hiding" is turned on, it will show it like this picture, but the "cost of it is that one point is missing (it needs to make a break in data in order to hide those connecting lines)
Compared to metatrader 5 this one can show literally any period from 1 minute to 1 month (so any time frame recognized by metatrader 5 (the 8 hour is rather useful in my opinion))
Additions - added 4 ways of calculating pivot points :
Added "alternate way" of calculating pivot support and resistance lines - I found that in a lot of versions the R3 and S3 are calculated differently than the original (it effectively makes it "tighter" than the original) so I decided to enable that way too__________________________
PS: no yearly pivot in this one
Here is a version with on option to limit how many pivot lines to display
As of yearly pivots: the indicator supports pivots for time frames supported by metatrader 5.
mladen,
thank you so much