You are missing trading opportunities:
- Free trading apps
- Over 8,000 signals for copying
- Economic news for exploring financial markets
Registration
Log in
You agree to website policy and terms of use
If you do not have an account, please register
No. What I wanted was to see a history of trading according to some precisely defined trading rules (so actual orders opened and closed for some period of time - ideal would be ate lest a week of forward testing to see the credibility of the defined rules on actual data). all the best
:-( I am unable to do that because I cannot monitor chart during day due to work and can't trade in us session as it time to sleep. The only time I get is a few hours during Uk session but trades don't come everyday. That was the whole point in getting this Ea working..I hope u would understand my dilemma....
It was not using highest or lowest (if that is what you have in mind) but the high or low BarToTest back. Thisversion has one more option adde : UseHighestLowest. If you set it to true, the it will use the highest high and the lowest low over BarToTest bars back. It UseHighestLowest is set to false it will works as before
Thanks Mladen,
That's a very interesting piece of code:
"PipsAdd ", "BarToTest" ...
Thanks Mladen.
Tomcat98
Thanks Mladen,
That's a very interesting piece of code:
"PipsAdd ", "BarToTest" ...
Thanks Mladen.
Tomcat98Tomcat98
Not my code
All I did is extend it with what was requested. As far as I am aware, it was primajaya who wrote the original version
Tomcat98
Not my code
All I did is extend it with what was requested. As far as I am aware, it was primajaya who wrote the original versionAnyway well done for the newest part of the code...
thanks Mladen
Tomcat98
Hi everyone,
I was wondering if the "Dynamic zone" logic could be used on 'spread trading/stat arb'
For eg, the first picture attached is the spread between EURUSD and GBPUSD with a 200 period bollinger band overlaid
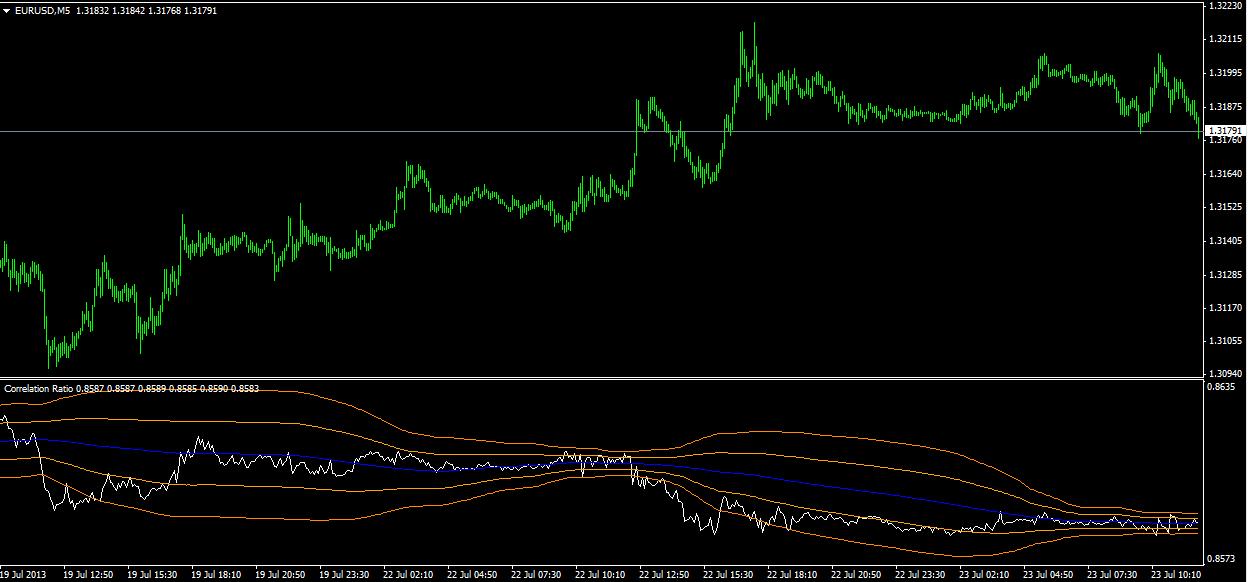
However, i was wondering if we could use the "Dynamic zone" logic to make it something like this picture
I tried overlaying both indicators on each other, but it wouldn't work because both of them use different number scales
I have attached the Correlation indicatorcorrelationratio.ex4
The EA does not open the tardes in the right place.
you need the indicator.
The EA does not open the tardes in the right place. you need the indicator.
dasssi
That EA does not use that indicator. The code logic how it opens orders is the following :
Sma = iMA(Symbol(),0,SMAPeriod,0,MODE_SMA,PRICE_CLOSE,0);
high = High;
low = Low;
smax = high - (high - low)*SkyCh / 100;
smin = low + (high - low)*SkyCh / 100;
if (Close[shift] < smin && shift!=0 && Open[shift]<Sma)
{
if (Reverse) BuyValue=1; else SellValue=1;
break;
}
if (Close[shift] > smax && shift!=0 && Open[shift]<Sma)
{
if (Reverse) SellValue=1; else BuyValue=1;
break;
}
}Dear mladen
Sorry I wasted your time.
Anyway, it's not a bad indicator under certain conditions.
I think that building an EA based on this indicator its a goog idea.
Dear mladen
Sorry I wasted your time.
Anyway, it's not a bad indicator under certain conditions.
I think that building an EA based on this indicator its a goog idea.I think that the main problem is that they tried to use the code from the indicator in the EA and it can not be done the way they did (if I am correct they made it a a kind of a repainting in the EA how it is coded). It needs to be revised to see what can be done to rectify that
I have found this Ea wich should works according to this indicator, more or less, I found them in Russian and I have no idea if it will work or not. Maybe you can use it.i dont speek russian.
Thank you for the time you have decided to spend in it