You are missing trading opportunities:
- Free trading apps
- Over 8,000 signals for copying
- Economic news for exploring financial markets
Registration
Log in
You agree to website policy and terms of use
If you do not have an account, please register
Master The Markets (Williams, Tom) - Friendly Traders Financial Trading Community
Hi

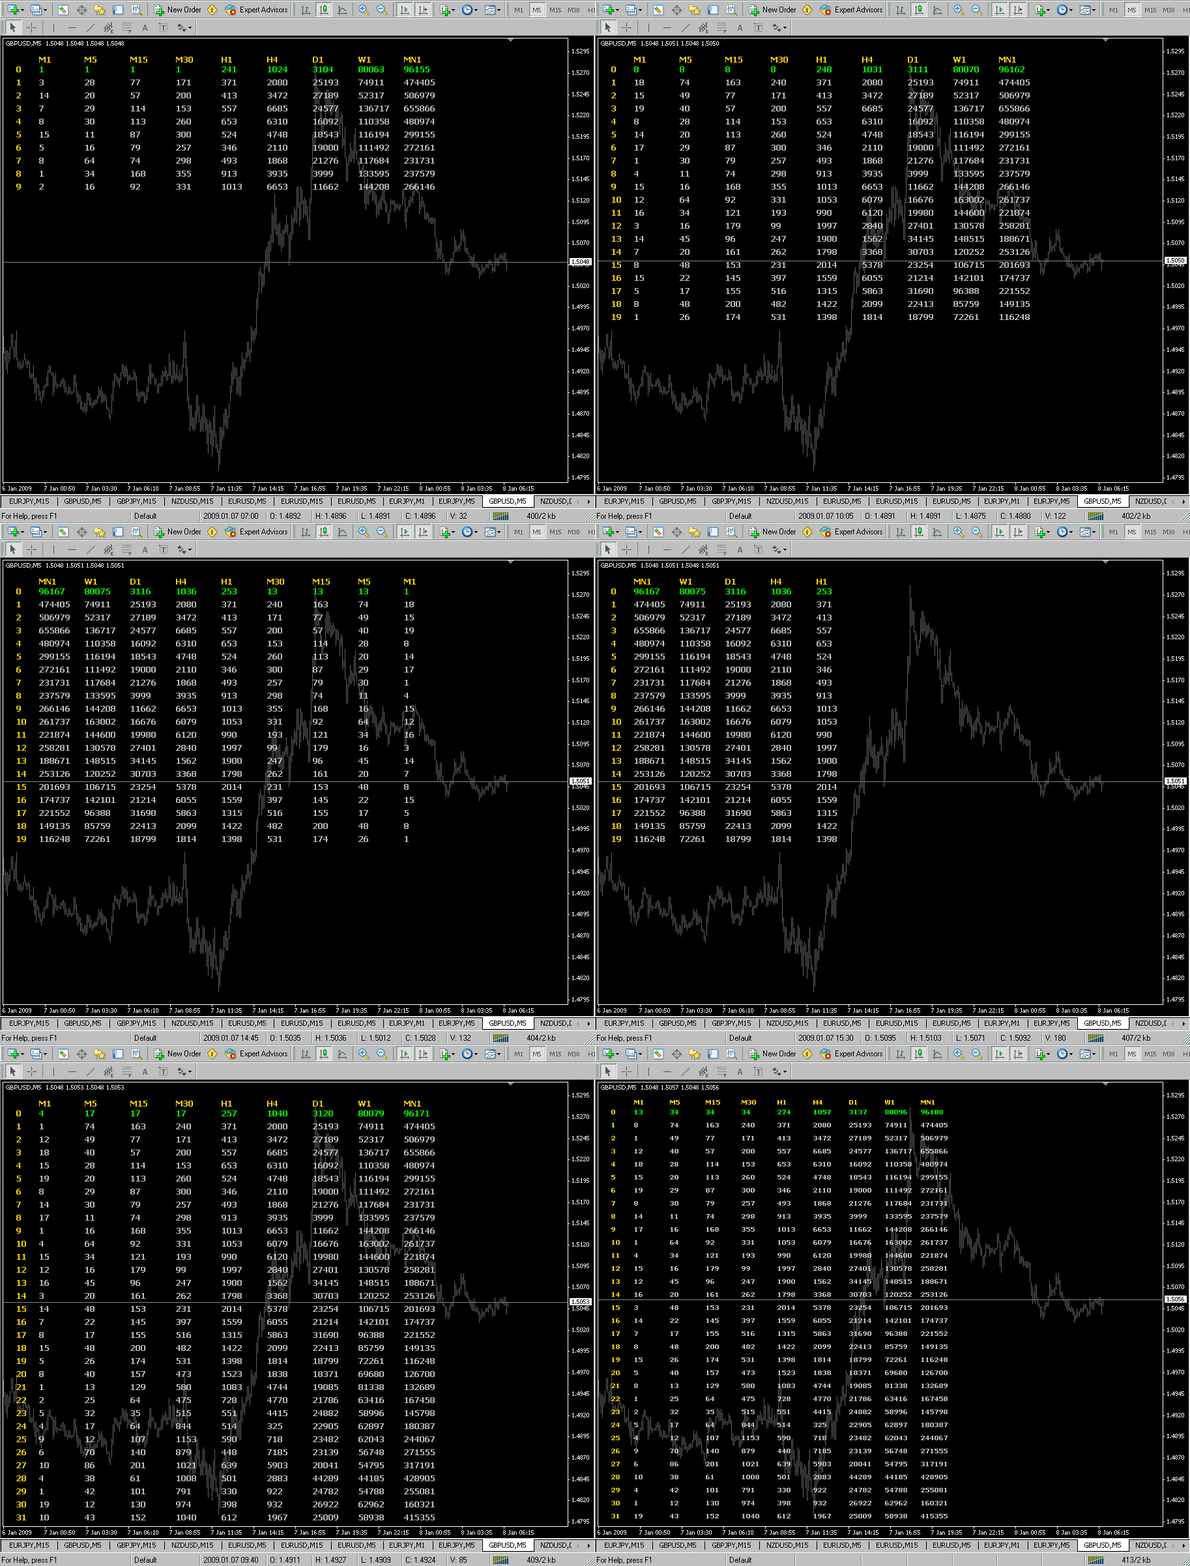
volume_mtf_display.ex4could you tell me what is "TimeFrames" parameter means?
I change from 9 to 14 ....yet nothing change
I think if we want to really use volume, then we have to move to currency futures. PVT relationships will always give you more clarity than just using PT alone.
indicator
hi cja
can you give me an example how you use your indicator?
thanks
lodol
Lanuary 12th review
Hi all.
Here I show how the previous week volumes work.
First of all we have to find the most heavy levels of the previous week and draw these levels on the combo bar chart to see where are we according to the previous week max. volume level. It will help to determine the most preferable trend for this week.
Here is volume rating
Yet another table to verify
Then we put these levels on the combo chart.
In this case the current week opened between previous week levels, so we have to wait for the price to break one of the bounds and then we trade if we have confirmation.
Today as a confirmation we had AM London fixing @ 848.50 and also we dont forget about this price that we met twice in volume rating tables.
Duting London session price goes under the lower week volume range. This fact also gives us the grounds to play short. Also it is confirmed by fixing price set @ 848.50.
Sell @ 848.50 SL - 851.00
TimeFrames"
could you tell me what is "TimeFrames" parameter means? I change from 9 to 14 ....yet nothing change
Nothing changed because there are only 9 Timeframes avaliable
M1 / M5 / M15 / M30 / H1/ H4 / D1 / W1 / MN1 you can select less than 9 to restrict the number of tomeframes but 9 is the max.
cja
Indicator usage
hi cja
can you give me an example how you use your indicator?
thanks
lodolHi
I can't give you an example of how i use this indicator as i don't use it , i made it purely to give anyone interested in volume a tool to show the volume numbers per bar over different timeframes in the hope it may prove to be useful in some way.
cja
A rough plan for tomorrow Jan 13th, 2009
General trend: Down (as we're currently under the maximum contract volume @ 850)
Mondey Max. Volume range: 824-825, 829
Week (01.05.2009): 854
Pit last hour range: 820-821
Tentative steps: Sell limit @ 825 S/L 827.50
Will revise during tomorrow London session.
Will revise during tomorrow London session.
Sorry to ask but i don't understand your signature.
Why skype you about demo accounts?, demo account of what?
Because the charts you're posting looks similar to some software we've moved to the Commercial section.
Master The Markets (Williams, Tom) - Friendly Traders Financial Trading Community
Would you mind posting the pdf of this book?
I can't get on this forum and i can't seem to find the book anyplace else.
Thanks