You are missing trading opportunities:
- Free trading apps
- Over 8,000 signals for copying
- Economic news for exploring financial markets
Registration
Log in
You agree to website policy and terms of use
If you do not have an account, please register
TRO MULTI METER - MIDPOINT
TRO MULTI METER - MIDPOINT shows the price relative to the previous candle's midpoint.
Thank You TRO, I will try it.
Many thank's to you.
ServerUang
Download all of the TRO MULTI METERS and create your own "Signal Bars".
All source code provided - NOTHING KEPT FROM THE TRADER.
Yess... thank you verymuch Sir.
TRO HLHIST
TRO HLHIST plots H[0] - H[1] and L[0]-L[1].
You can use this to determine profitable patterns.
SOURCE CODE ATTACHED.
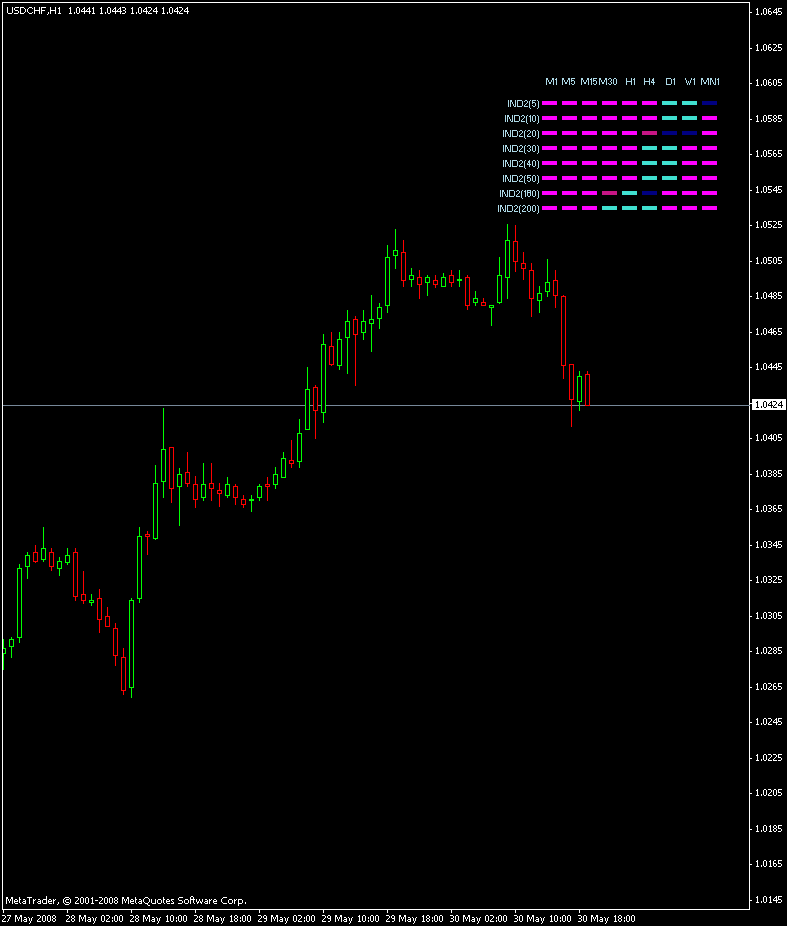
TRO MULTI METER IND2
You can load TRO MULTI METER IND2 as many times as you want.
Just change the inputs so they don't write on top of each other.
Agua colored bar indicators price is above rising moving average.
Navy colored bar indicators price is above falling moving average.
Magenta colored bar indicators price is below falling moving average.
MediumVioletRed colored bar indicators price is below rising moving average.
Of course, you can change the colors via input.
Template and indicator attached.
RANGE GAUGE - TheRumpledOne
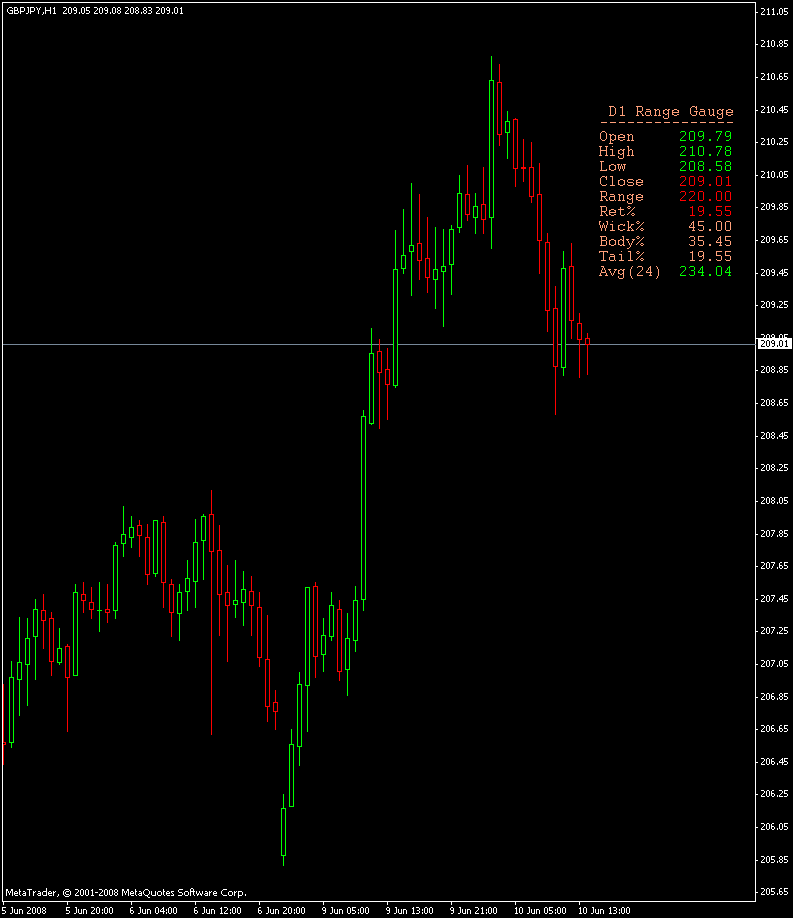
TRO RANGE GAUGE
TRO RANGE GAUGE displays range information.
Open is candle's open price. Green if above previous candle's open price, red if below.
High is candle's high price. Green if above previous candle's high price, red if below.
Low is candle's low price. Green if above previous candle's low price, red if below.
Close is candle's close price. Green if above previous candle's close price, red if below.
Range is today's range. Green if above yesterday's range, red if blow.
Ret% is retrace percentage off today's low.
Wick% is the wick (high - candle top) percentage of the range.
Body% is the candle body (candle top - candle bottom) percentage of the range.
Tail% is the tail (candle bottom - low) percentage of the range.
Avg(x) is the average range over the last X bars. Green is above today's range, red if below.
MT4 CODE ATTACHED.
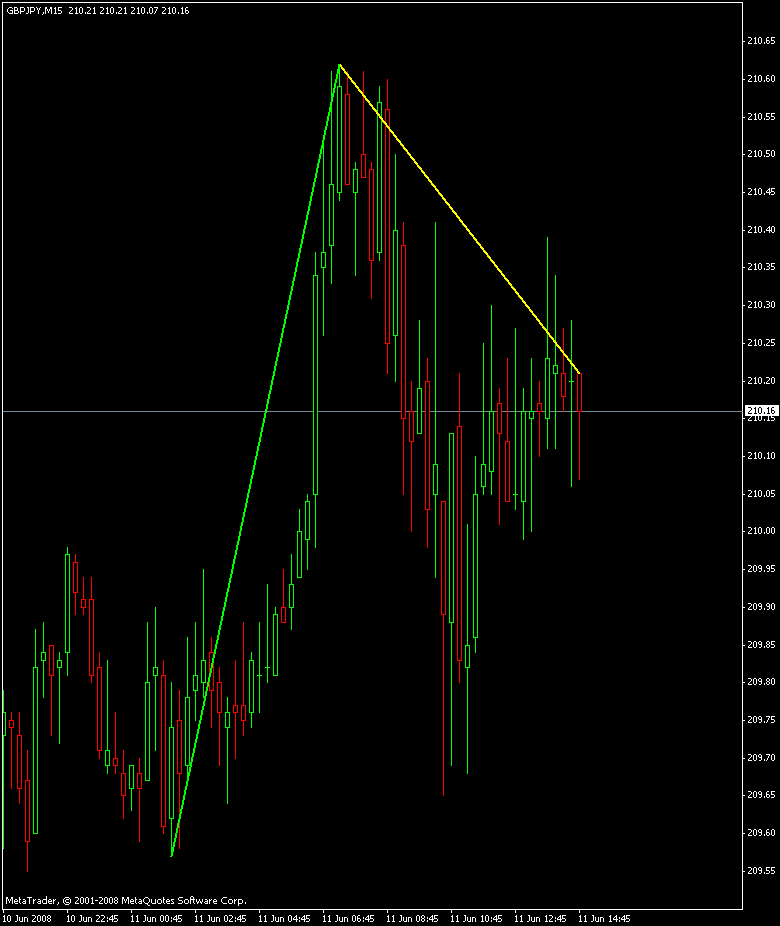
TRO TREND METER
The TRO TREND METER plots a trend line from the day's high to the day's low. It also plots a line from the day's high/low, whichever was most recent, to the current bar. This shows where price is in relation to the current trend.
MT4 CODE ATTACHED.
Is anyone using the Trend Meter?
If yes, please post a chart or two.
Thanks.
Hi TRO,
I try your STR indi, but what does the "Label" mean? It just came up suddenly.
Thanks.