Narrow Range Day Indicator
# Hi Low - Open Close CANDLES
Can anybody here create an indicator that will identify a day with the narrowest range out of the last 4 or 7 days? This is used by a lot of pro traders and hedge fund guys who like to trade breakouts of these days' ranges. If you do it I will be happy to share what I've learned about them so far, but I need more data to look at to confirm what I've seen so far.
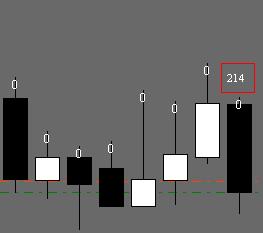
I think will do what you want i originally made this indicator to show inside outside candles however if you set it to Daily (1440) it will show the last 7 Daily Candles and gives the number of pips each has moved so it is pretty easy to see which day has the most narrow range.
I think will do what you want i originally made this indicator to show inside outside candles however if you set it to Daily (1440) it will show the last 7 Daily Candles and gives the number of pips each has moved so it is pretty easy to see which day has the most narrow range.
excellent work cja!
am I correct in assuming that the shaded areas are based on the previous days action?
Anything outside the shaded area is considered an extreme point?
Please correct me if my thinking is wrong about the indicator.
Shaded areas
excellent work cja!
am I correct in assuming that the shaded areas are based on the previous days action?
Anything outside the shaded area is considered an extreme point?
Please correct me if my thinking is wrong about the indicator.The shaded areas are the Open/Close if the Open is lower than the Close the color is Green and if the Open is higher than the Close the color is Red the outer rectangle is the High and Low for the candle. In short the Shaded areas are the body of a normal candle and the outer rectangle represents the wicks, if you go into the inputs you will find you can bring up the "Legend" which will tell you what the other colors mean, you can also enlarge or reduce the text to suit your needs or remove it entirely. Enjoy.
cja
Pip Counting per trading Session
Could this indicated be changed to count pips per trading session
count the number of pips between 00:00gtm to 2:00 for example
adding multable time sessions
I think will do what you want i originally made this indicator to show inside outside candles however if you set it to Daily (1440) it will show the last 7 Daily Candles and gives the number of pips each has moved so it is pretty easy to see which day has the most narrow range.
could you please help me with coding 
i would like to have two lines starting at the close of two different bars every day , is that possible , i would apprisciet any help ( sorry for my english :P)
I moved your post to this thread where you will fond some indicator. It is not exactly what you want but very similar. And look at this thread also.
it s possible to modificate that indicator with the high and low to the open and close of two different bars ?
let s assume that a would like to plot two lines one starting at 9 am european time at the close of the bar and an other one at 12 am it s possible ?
help
i want to build an indicator that count (high-low) for every single daily bar and that count text is above the bar. Anyone can help?
I think will do what you want i originally made this indicator to show inside outside candles however if you set it to Daily (1440) it will show the last 7 Daily Candles and gives the number of pips each has moved so it is pretty easy to see which day has the most narrow range.
Hello cja , for six month i'm searching this kind of indicator finally i founded this indicator that made it by yours. From what i can see from the indicator it seem that the indicator will only show the range for only 7 days . Could you make it for all day ? i mean from beginning to the end of data that i have . I know that you're a busy man , but if you could make it i will really appreciate it. thank you and sorry for my bad english
Please Change more than 7 candles
Could you please add an option to change for more candles to show or please
post the code and i will do it
thank you for your time
I think will do what you want i originally made this indicator to show inside outside candles however if you set it to Daily (1440) it will show the last 7 Daily Candles and gives the number of pips each has moved so it is pretty easy to see which day has the most narrow range.
- Free trading apps
- Over 8,000 signals for copying
- Economic news for exploring financial markets
You agree to website policy and terms of use
Can anybody here create an indicator that will identify a day with the narrowest range out of the last 4 or 7 days? This is used by a lot of pro traders and hedge fund guys who like to trade breakouts of these days' ranges.
If you do it I will be happy to share what I've learned about them so far, but I need more data to look at to confirm what I've seen so far.