Simple (i think) question RE iMA
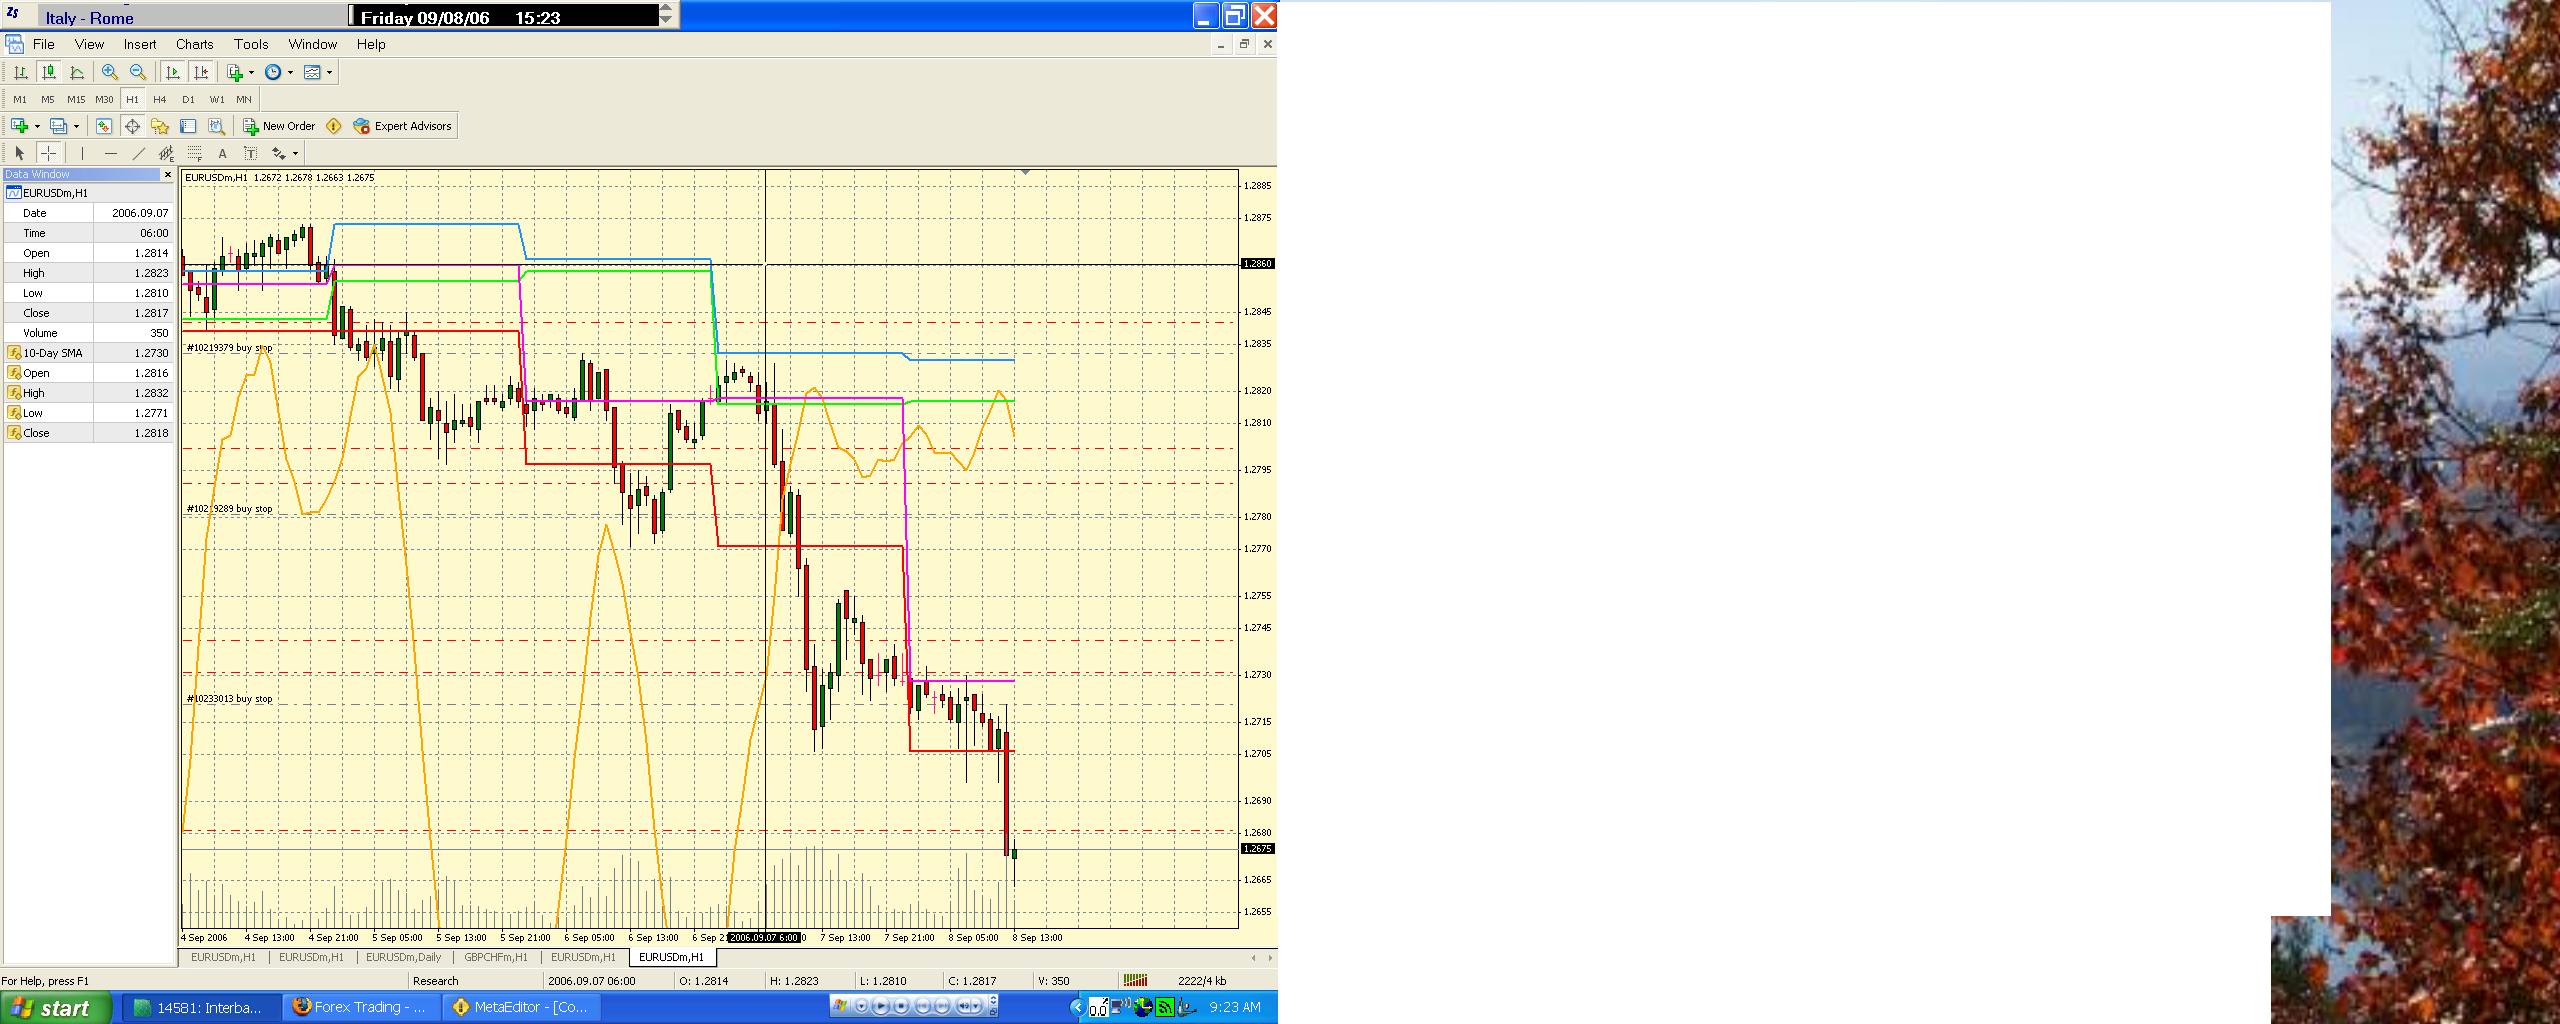
Here is the chart. I just did a printscreen and then saved as jpeg in paint. The wavy line is the value given by iMA. It shows up in the data window as CodersGurusCode, because basically it's the sample he posted elsewhere. The other lines are the open, high, low, close from the previous day (daily bar). I coded these without using iHigh, etc...because of the same problem I'm having with iMA. This is how my MA value should look...a straight line throught the day and then another straight line the next day...etc..
Any help is appreciated. Thank you.
It should be on this thread https://www.mql5.com/en/forum/173574
Thank you New_Digital. The code I downloaded from that thread seems to work. Now I just have to figure out the difference between the two.
- Free trading apps
- Over 8,000 signals for copying
- Economic news for exploring financial markets
You agree to website policy and terms of use
I've searched the forum concerning this question and the closest thing I've found to an answer was found here :
https://www.mql5.com/en/forum/173165
Anyway, I'm trying to get a simple moving average (10 in this case) from a daily chart to show up on a lower time frame. Preferably hourly, but it shouldn't matter and I don't care which time frame.
If I code the indicator using iMA like so, :
SMA10Price[pos]= iMA(NULL,1440,10,0,MODE_SMA,PRICE_CLOSE,pos);
then I get a line, but it moves way much more than it should, zig-zagging about on the 60 min chart. Since it is supposed to be showing the value of the 10-day SMA and the daily bar only closes one time/day on the 60 min chart, it should retain the same value throughout a whole day.
I feel like I'm missing something here, because I've had a similar problem with all of the i... functions when I've tried using them. Would someone please help me out, since my other option is to code these solutions in a MUCH more cumbersome manner?
If necessary, I can post all of the code for the sample indicator. I could also post the chart...I'll have to figure out how to save my chart as a jpeg or something (I'll search the forums.)
Please help!
Thanks in advance,
Brandon