You are missing trading opportunities:
- Free trading apps
- Over 8,000 signals for copying
- Economic news for exploring financial markets
Registration
Log in
You agree to website policy and terms of use
If you do not have an account, please register
Thanks mladen, but it doesn't work : same result as posted previously ( I'm using the strategy tester to check if it works ).
You have to copy the "news.csv" file to tester->files too
The the result is the following :
Dear Mladen
Thanks for directing me here for the coding request. I need your Daily Data NMC with Daily average included.
Kindly help Sir.
Regards
Thanks mladen ..... it's perfect now
Just checking in - is it possible to build this?
Hello Mladen - as always thanks for your response - is it within your skill set to possibly build such an indicator? thanks in advance again.
Sorry I didn't add this to the prior post - this is what I'm asking about - thanks in advance for your help/response.
Good morning and thanks for your quick response. The page you directed me to has some interesting things in it but is not exactly what I need. Let me better explain....swing 1 of the zig/zag is 60 pips from top to bottom - swing 2 is 44 pips from top to bottom - swing 3 is 106 pips from top to bottom - swing 4 is 86 pips from top to bottom - the current swing is still active and adjusting to price. What I want to do is to have an indicator that will give the average number of pips of the last 4 completed swings as a number displayed on the chart. No need to see the zig/zag indy displayed on chart - just need the average of last "X" swings displayed. In the example above the indicator give me a reading of "74" ( 60+44+106+86 divided by 4 ) Hope this better explains it. Thanks in advance again.
Sorry I didn't add this to the prior post - this is what I'm asking about - thanks in advance for your help/response.
Regardless of the dirrection?
______________
PS: which zigzag are you using? Please attach it
Hi, Mladen please help.
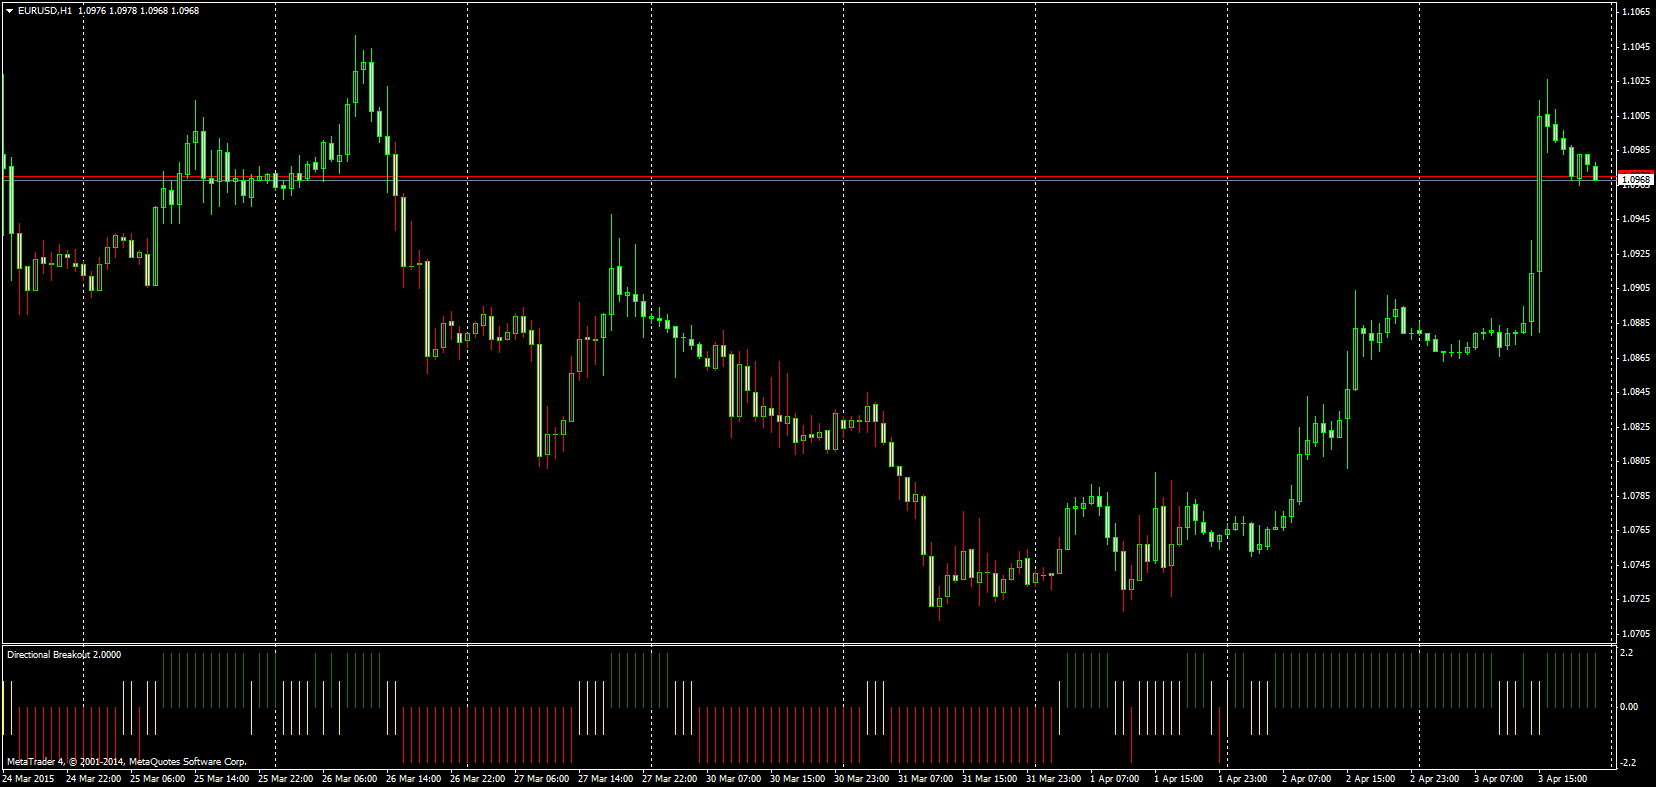
I will like to have this indicator on main chart ( not like now in separate window) or like candle color indicator.
Is it possible for you to code something like this?
Thank you in advance Here is picture and indicator.
directional_breakout.mq4
I have found this indicator an it looks like something similar...
Can you look at this two indicators? They both use SMA to define trend...
ttf_trend_candlev2.mq4
I have found this indicator an it looks like something similar...
Can you look at this two indicators? They both use SMA to define trend...

ttf_trend_candlev2.mq4You mean to color the bars according to ttf candle trend (colors) ?
No, oposite to color candles according to Directional Breakout, to have green, yellow and red candles. If it is possible.