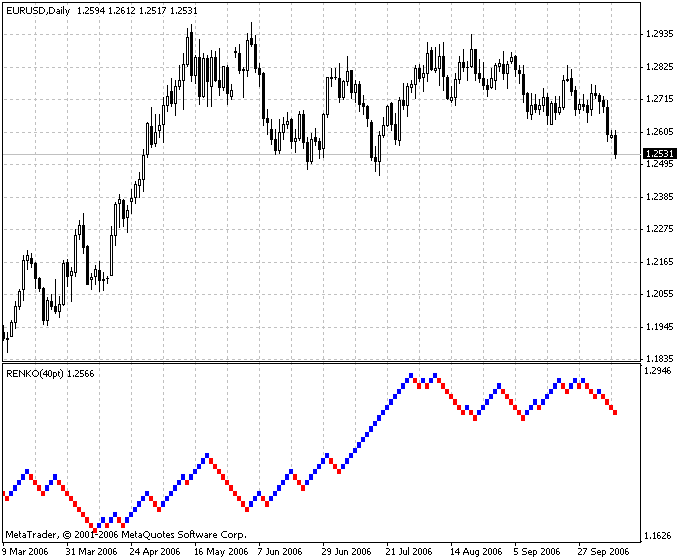
Found one here but its only its not in english.
many thanks again.
renko
It depends what platform you are using , I havent seen a successful renko for metatrader but some other platforms do have them
Renko for MT4
This Renko doesn't seem quite like the others. I'm used to setting .002 for 20 pips on the majors, 0.5 for G/J, etc... but this one doesn't seem to allow for decimals. If I want 20 pips per box, would I put that in as just a straight 20, then? This particular Renko also seems to scale according to timeframe, which doesn't sound quite right. Is it used slightly differently? Is there perhaps a tutorial somewhere?
Many thanks in advance,
-=Black Knight
fxKnight.com : Tools and Strategies to Empower the Forex Warrior
From "Technical Analysis from A to Z":
Renko
Overview
thought to have acquired its name
from "renga" which is the Japanese word
for bricks. Renko charts are similar to
Three Line Break charts except that
in a Renko chart, a line (or "brick"
as they're called) is drawn in the
direction of the prior move only
if prices move by a minimum amount
(i.e., the box size). The bricks are always
equal in size. For example, in a 5-unit
Renko chart, a 20-point rally is displayed
as four, 5-unit tall Renko bricks.
Kagi charts were first brought to
the United States by Steven Nison
when he published the book, Beyond Candlesticks.[/CODE]
Interpretation
[CODE]Basic trend reversals are
signaled with the emergence
of a new white or black brick.
A new white brick indicates
the beginning of a new up-trend.
A new black brick indicates
the beginning of a new down-trend.
Since the Renko chart is a trend
following technique, there are
times when Renko charts produce
whipsaws, giving signals near the end
of short-lived trends. However,
the expectation with a trend following
technique is that it allows you to ride
the major portion of significant trends.
Since a Renko chart isolates
the underlying price trend by
filtering out the minor price changes,
Renko charts can also be very
helpful when determining support
and resistance levels.Thanks
Thanks, NewDigital... appreciate the reference. I'm familiar with the theory, was just having trouble with the settings on THIS particular Renko indicator (Renko_2 for MT4). Hard to put in 0.02 when no decimal point is allowed, thus I'm wondering if "20 pips per brick" would be input as just 20? 2? Etc.
Thanks again,
-=Black Knight
fxKnight.com : Tools and Strategies to Empower the Forex Warrior
actual Renko charts in the candles (not as indicator)
Hi,
has anyone ever tried to make renko charts (candles that are based on number of pips in one direction: candles close after e.g. 20 pips up or down, and don't close after a certain period of time e.g. 15min)? I have found a custom indicator that displays a renko indicator at the bottom of the chart, but I need the actual candles in my chart to be "renko candles".
thx
I moved your post to this thread.
The other thread about it is here https://www.mql5.com/en/forum/general
- Free trading apps
- Over 8,000 signals for copying
- Economic news for exploring financial markets
You agree to website policy and terms of use

If someone could put together an actual Renko indicator for us it would be really helpful, I know I and some others would be very appreciative.
Not a line or histogram based renko indicator, but the real box renko.-between convictions.
Its extremely useful for making sense when the market is in
Many many thanks.
006