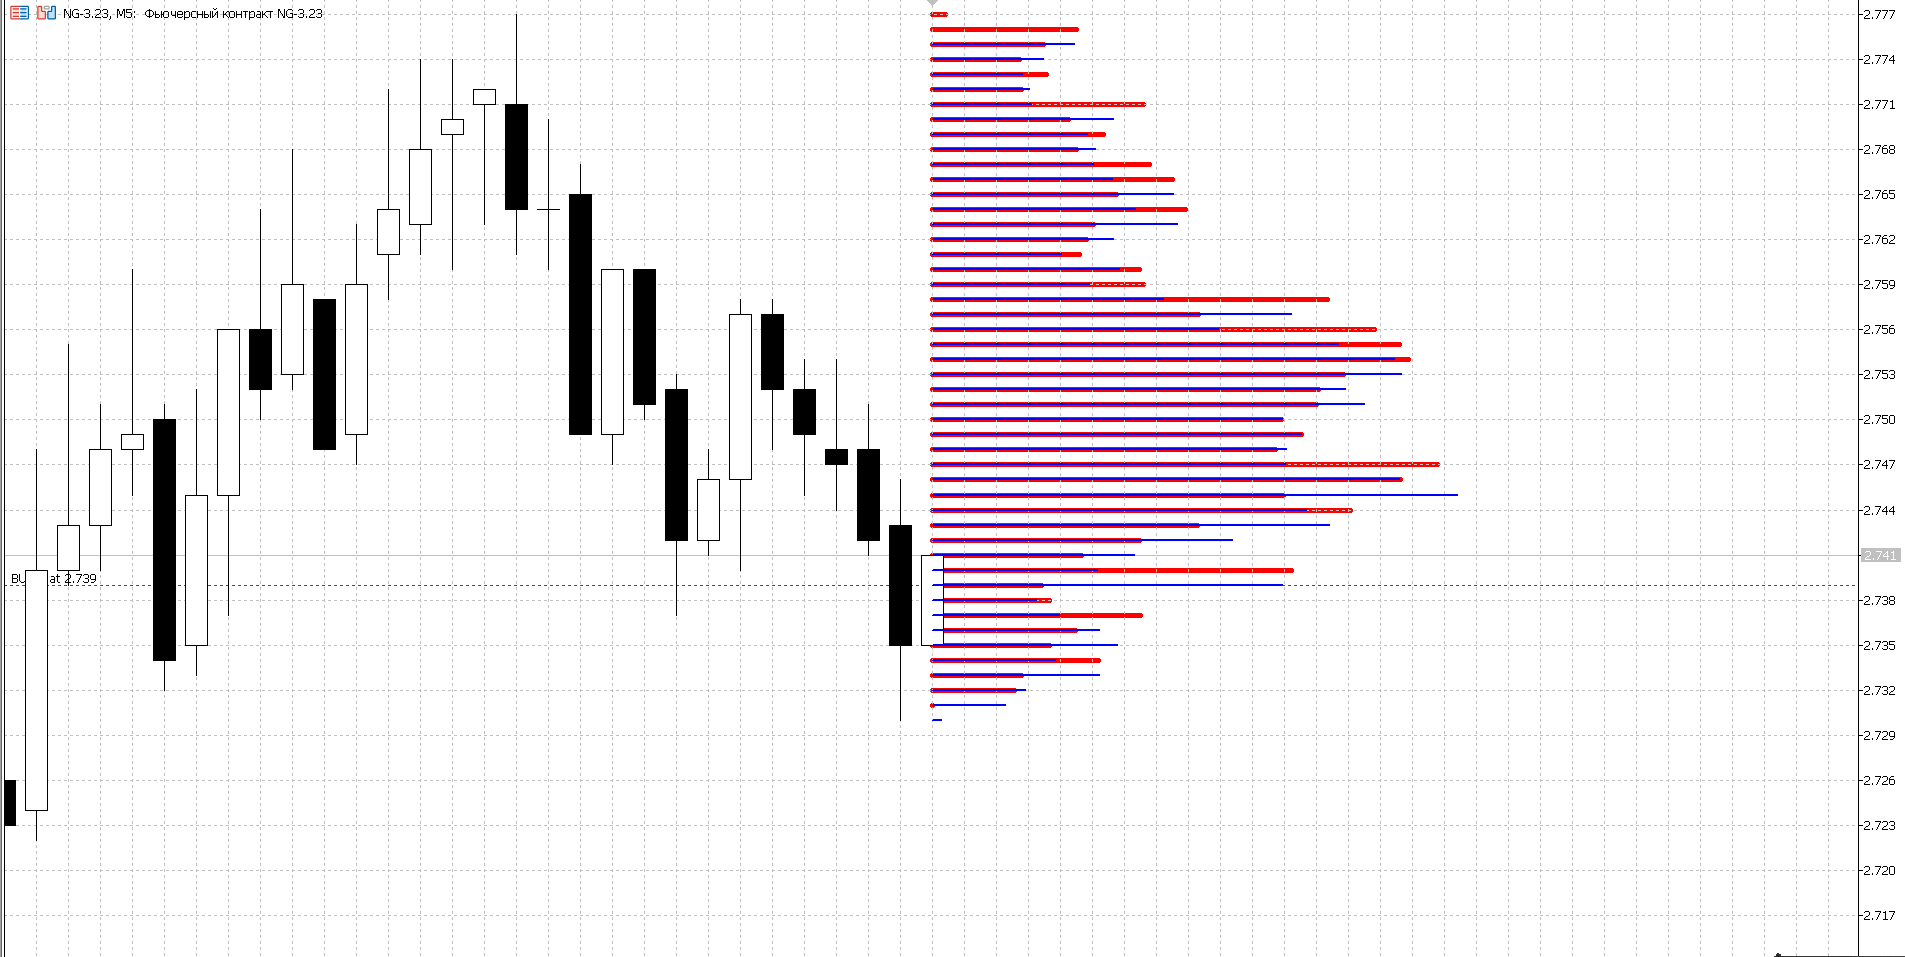
Indicators: Histogram Bid and Ask prices
Добавте расчет на живом графике с выбором даты начала расчета , если это возможно , и дельта тоже не помешает . На high_and_low и open_and_close невозможно определить внутри дня кто преобладает ,так как смещается объем и на глаз не определить , дополнительный указатель в виде стрелок не помешает .
hello, can you modified this indicator to add grid for big round numbers and show the latest large volume at specific price level....because the bar are too small to see
It would be good to make a construction from vertical line to vertical line with designation of extremum of the traded volume and indication of delta and in this form and not as you have here at least visually clear who rules
Question; how can this have a .mq5 extension used for EA's instead of a .mqh extension normally used with Indicators?
You are missing trading opportunities:
- Free trading apps
- Over 8,000 signals for copying
- Economic news for exploring financial markets
Registration
Log in
You agree to website policy and terms of use
If you do not have an account, please register
Histogram Bid and Ask prices:
Author: Sergey Pavlov