Forum on trading, automated trading systems and testing trading strategies
Sergey Golubev, 2016.12.31 14:33
USD/CAD Technical Analysis: At Strong Support For 2017 (based on the article)
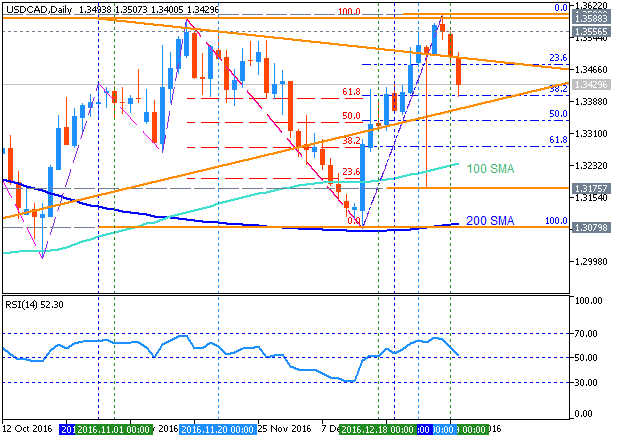
- "The last week of 2016 trading has brought about USD weakness. As we come into the Macro Opening Range of 2017, traders will do well to keep an eye on a breakout above the 50% retracement of the 2016 range. The market tested the key 50% Fibo in mid-November but failed to close above it, and we’ve seen a similar occurrence in late December."
- "However, a close above the 50% Fibo (1.3575) in the first weeks of 2017 could usher in another strong move higher like we’ve seen in the first trading month of the year in USD/CAD in the prior couple of year."
- "In addition to watching the 50% retracement as resistance and validation of trend continuation, the most important component on the USD/CAD chart remains the strong bounce off of multiple levels of support all near 1.31/3075. This price zone combined the 200-day moving average at 1.3087, the 61.8% Fibonacci retracement of the August – November price range, the Ichimoku cloud base, and the combination of the Modified Schiff Pitchfork / Trendline support drawn off key pivots of the May, June, and August. The bounce came as the market digested the Federal Reserve’s actual hike and added a more hawkish Dot Plot."
Forum on trading, automated trading systems and testing trading strategies
Sergey Golubev, 2017.01.05 07:25
USD/CAD Technical Analysis: trading near Yearly Central Pivot at 1.3575 for direction (based on the article)

- "USD/CAD broke below 1.3300 on Wednesday morning, which puts the pair on a downward trend the start of 2017. USD strength continues to be a broader theme that many are still watching, but we have recently noted that DXY is found resistance in the medium-term while RSI(5) is showing bearish divergence that could allow other currencies like the Canadian dollar to gain ground."
- "One of the key themes that have developed over past weeks for the Canadian dollar is a supportive Bank of Canada that looks to err on the side of hawkishness that could continue to support CAD and put further pressure on USD/CAD."
- "One strong technical point worth keeping an eye on is the trend line drawn from the higher lows in the base of the channel created with the Modified Schiff pitchfork near the 78.6% retracement of the December range near 1.3200."
Forum on trading, automated trading systems and testing trading strategies
Sergey Golubev, 2017.01.15 06:37
Weekly Fundamental Forecast for USD/CAD (based on the article)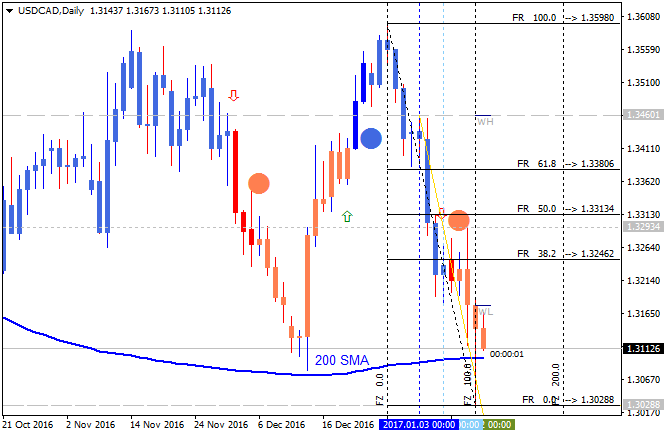
USD/CAD - "CAD currently sits as one of the strongest currencies in G10FX alongside AUD that is working on its third weekly advance and NZD with a ~2.5% weekly appreciation. Given the commodity dollar-bloc strength, it’s fair to think that the momentum could continue, which would likely translate further into both technical and fundamental favor likely leading to further CAD strength. Thursday’s USD/CAD move brought the lowest price since October, and the previously mentioned momentum would favor continuation without a USD/CAD close above Wednesday’s high of 1.3293."
Forum on trading, automated trading systems and testing trading strategies
Sergey Golubev, 2017.01.18 09:10
USD/CAD Ahead of BOC Rate Decision: daily bearish reversal; intra-day ranging bearish (based on the article)
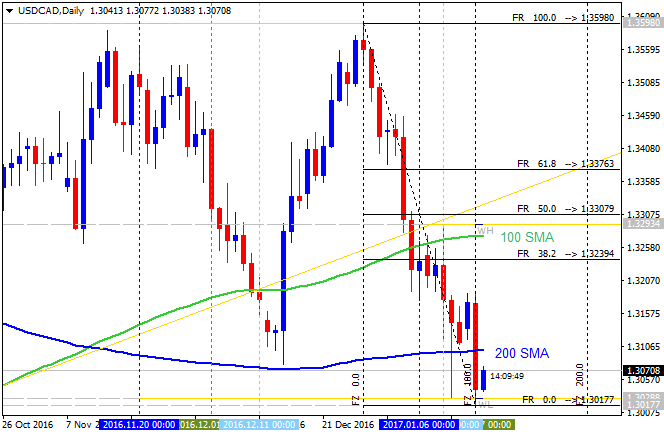
Daily price broke 100-day SMA/200-day SMA levels for the reversal to the primary bearish trend. The price is testing support level at 1.3017 to below for the bearish breakdown to be continuing.
- "The USD/CAD has pressed to new 2017 lows at 1.3018, but the pair is now rebounding from this morning’s decline. Today’s decline has come ahead of Bank of Canada rate decision, where rates are expected to remain at 0.50%. While rates are expected to be unchanged, traders will look towards future policy cues from Governor Stephen Ploz that may directly affect the USD/CAD."
- "Technically the USD/CAD has turned bearish with the pair breaking below its daily 200 period moving average (MVA). This average resides at 1.3102, and if prices close beneath this value it will be the first time for the currency pair to do so in three months. While today’s price action qualifies as a daily breakout, traders will next look for the pair to close under the January 12th low at 1.3028. A move beyond this point exposes the next point of daily support near the psychological 1.30000 value. Alternatively if prices rebound near present values, bullish USD/CAD signals may begin again once the pair has risen back above the previously mentioned average."
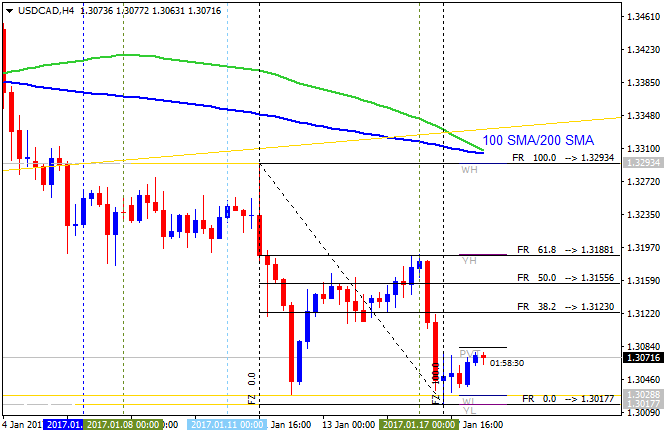
H4 intra-day price is below 100 SMA/200 SMA in the bearish area of the chart. The price is started for the ranging within 61.8% Fibo level at 1.3188 and Fibo level at 1.3017.
If the price breaks 1.3188 resistance level to above so the rally will be started.
If the price breaks 1.3293 resistance level to above so we may see the the bullish reversal of the intra-day price movcement.
If the price breaks 1.3017 support level to below so the intra-day bearish trend will be resumed.
If not so the price will be on bearish ranging within the levels.
- "Intraday, the USD/CAD is trading well below today’s S4 pivot at 1.3128. While this bearish breakout occurred earlier in the session, traders may continue to use this point as an intraday point of resistance to time retracement entries. Traders looking for a bullish USD/CAD reversal should also continue to monitor today’s S4 pivot. If prices move back above this point, the next key value for the USD/CAD falls at 1.3150. A move here would suggest an invalidation of this morning’s breakout, and suggest at least a temporary change in the short term trend."
Forum on trading, automated trading systems and testing trading strategies
Sergey Golubev, 2017.01.20 15:32
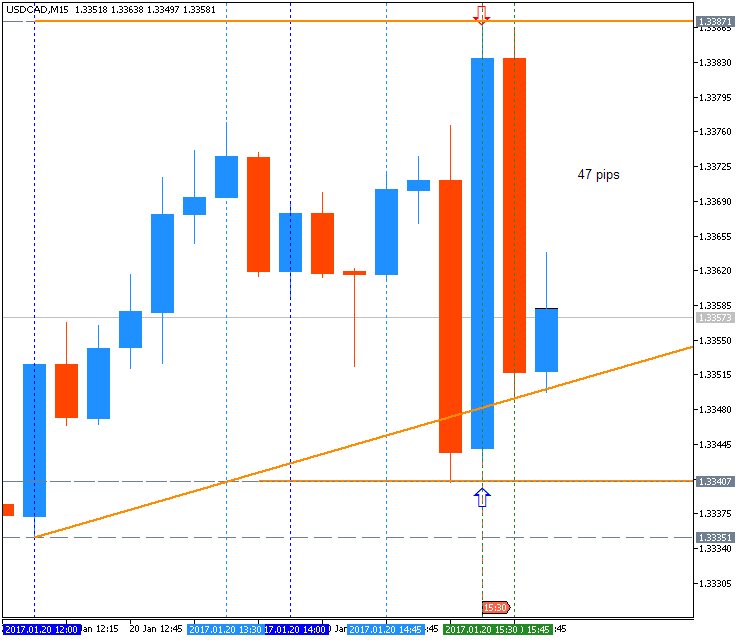
USD/CAD Intra-Day Fundamentals: Canada's Consumer Price Index and 47 pips range price movement
2017-01-20 13:30 GMT | [CAD- CPI]
- past data is -0.4%
- forecast data is 0.0%
- actual data is -0.2% according to the latest press release
if actual > forecast (or previous one) = good for currency (for CAD in our case)
[CAD- CPI] = Change in the price of goods and services purchased by consumers.
==========
From official report:
The Consumer Price Index (CPI) rose 1.5% on a year-over-year basis in December, following a 1.2% gain in November.
==========
USD/CAD M5: 47 pips range price movement by Canada's Consumer Price Index news event
Forum on trading, automated trading systems and testing trading strategies
Sergey Golubev, 2017.01.28 15:38
Weekly Fundamental Forecast for USD/CAD (based on the article)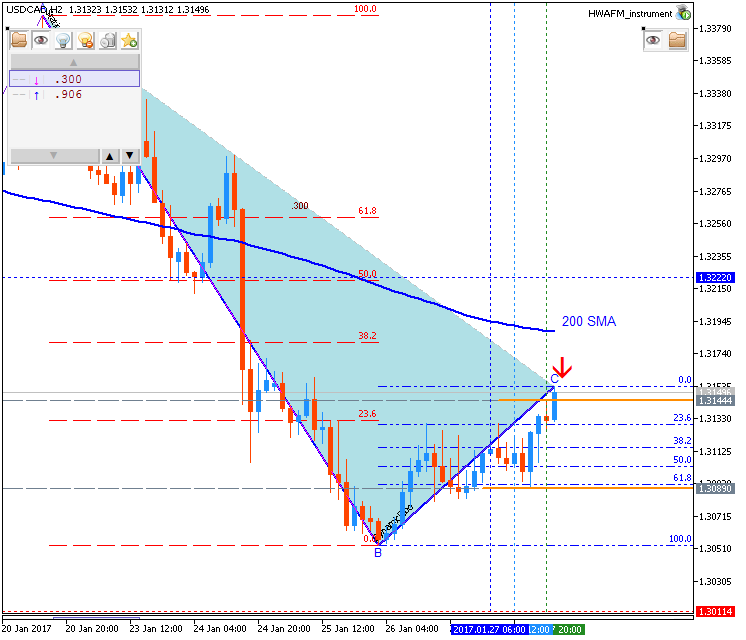
USD/CAD - "Next week provides YoY GDP data from November on Tuesday where we’ll look for an improvement on the prior reading of 1.5%. One of the clearer markers for a potential relative gain of the Canadian Dollar to the USD is the spread tightening between US and CA Government 2Yr yields. From July to November, we saw the spread between US & CA Government 2 Yr yields widen from .0591 on July 5 to a high of .4788 between the two on December 28. The US 10-year premium more than doubled from last springs low of 32 bp to 81 bp high in late-November. On December 28, USD/CAD traded to 1.3598 as a widening spread favors USD strength in the current environment and a narrowing or stabilization of yield spreads leads to a stronger CAD and relatively weaker USD. If the yield continues to narrow, we may see further CAD strength from a combination of positive economic surprises. When looking at the chart, a break below 1.3000 would help validate that we’re seeing a resumption of CAD strength through a long-term barrier of support on USD/CAD and resistance on CAD. The spreads are always worth watching because a widening of the spreads again could mean the USD strength that has been dormant in January is resuming."
Forum on trading, automated trading systems and testing trading strategies
Sergey Golubev, 2017.01.31 15:53
USD/CAD Intra-Day Fundamentals: Canada's Gross Domestic Product and 80 pips range price movement
2017-01-31 13:30 GMT | [CAD - GDP]
- past data is -0.2%
- forecast data is 0.3%
- actual data is 0.4% according to the latest press release
if actual > forecast (or previous one) = good for currency (for CAD in our case)
[CAD - GDP] = Change in the inflation-adjusted value of all goods and services produced by the economy.
==========
From official report:
- "Real gross domestic product rose for the fifth time in six months, up 0.4% in November. The increase in November came mainly from higher output in manufacturing, mining, quarrying, and oil and gas extraction, finance and insurance and construction."
==========
USD/CAD M5: 80 pips range price movement by Canada's Gross Domestic Product news event

Forum on trading, automated trading systems and testing trading strategies
Sergey Golubev, 2017.02.04 16:41
Weekly Fundamental Forecast for USD/CAD (based on the article)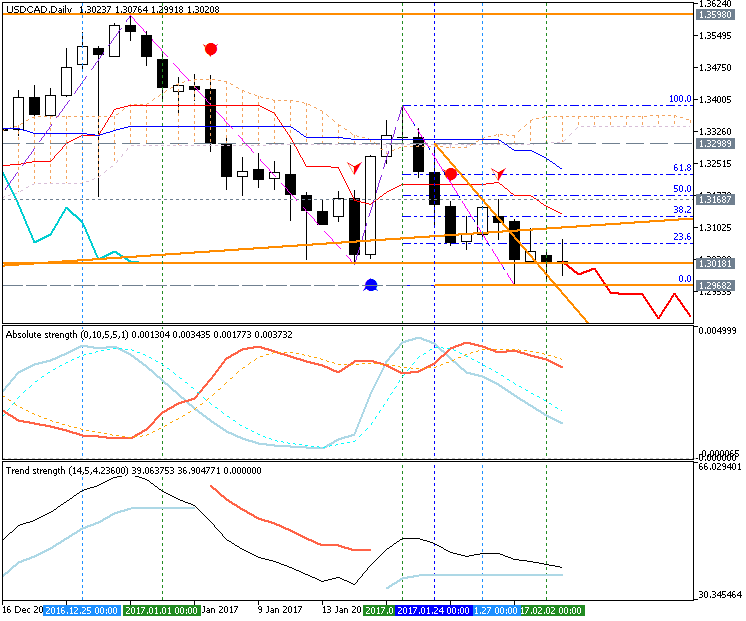
USD/CAD - "The two significant pieces of economic data next week come on Wednesday's Housing Starts, which is expected to show 207k starts, and could surprise as recent data showed Toronto homes showing a supply shortage that is keeping prices elevated. Next week will close with Canadian Unemployment figures, which showed a 46.1k addition in December, and a reading of +53.7k is anticipated for January payroll growth according to Bloomberg. One of the more exciting components has been the shift toward full-time employment and simultaneous drop in part-time employment, which is a fundamental factor in longer-term economic growth."
Forum on trading, automated trading systems and testing trading strategies
Sergey Golubev, 2017.02.07 17:44
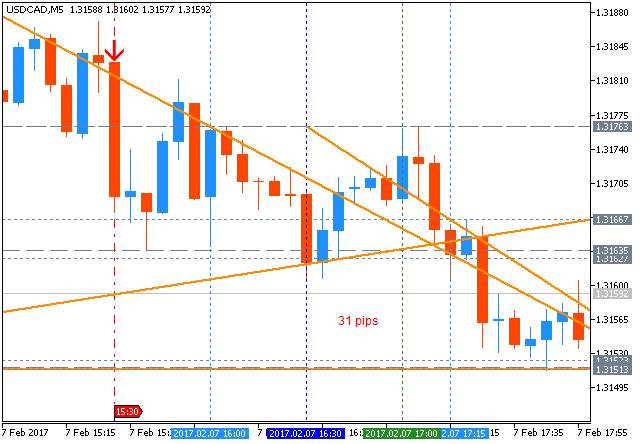
USD/CAD Intra-Day Fundamentals: Canada's Trade Balance and 31 pips range price movement
2017-02-07 13:30 GMT | [CAD - Trade Balance]
- past data is 1.0B
- forecast data is 1.2B
- actual data is 0.9B according to the latest press release
if actual > forecast (or previous one) = good for currency (for CAD in our case)
[CAD - Trade Balance] = Difference in value between imported and exported goods during the reported month.
==========
From official report:
- "Canada's merchandise trade balance with the world recorded its second consecutive monthly surplus, narrowing from a revised $1.0 billion in November to $923 million in December. Exports were up 0.8% on the strength of higher energy product prices. Imports increased 1.0%, mainly on stronger imports of aircraft and industrial machinery."
- "In real (or volume) terms, exports were down 1.4% in December as a result of declines in metal ores and non-metallic minerals as well as motor vehicles and parts. Import volumes were up 0.4% on higher real imports of industrial machinery, equipment and parts. Consequently, Canada's trade surplus with the world in real terms narrowed from $2.9 billion in November to $2.1 billion in December."
==========
USD/CAD M5: 31 pips range price movement by Canada's Trade Balance news event
Forum on trading, automated trading systems and testing trading strategies
Sergey Golubev, 2017.02.10 14:42
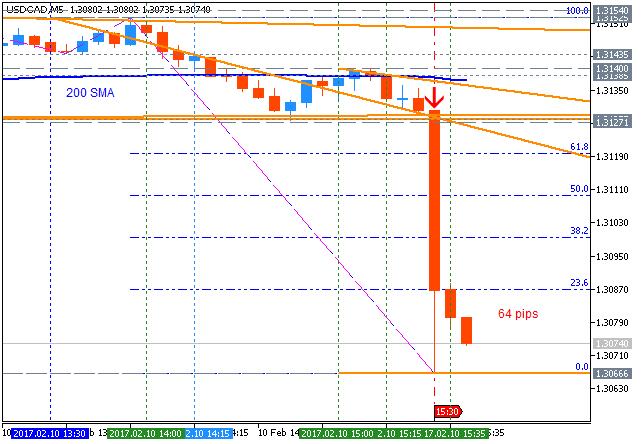
USD/CAD Intra-Day Fundamentals: Canada's Employment Change and 64 pips range price movement
2017-02-10 13:30 GMT | [CAD - Employment Change]
- past data is 53.7K
- forecast data is -10.1K
- actual data is 48.3K according to the latest press release
if actual > forecast (or previous one) = good for currency (for CAD in our case)
[CAD - Employment Change] = Change in the number of employed people during the previous month.
==========
From official report:
- "CEmployment rose by 48,000 (+0.3%) in January, building on gains observed in the latter part of 2016. The unemployment rate fell by 0.1 percentage points to 6.8%."
- "On a year-over-year basis, employment rose by 276,000 (+1.5%), with most of the increase occurring from August to January."
==========
USD/CAD M5: 64 pips range price movement by Canada's Employment Change news event
- Free trading apps
- Over 8,000 signals for copying
- Economic news for exploring financial markets
You agree to website policy and terms of use
USD/CAD January-March 2017 Forecast: ranging within Ichimoku cloud for direction
W1 price is located to be inside Ichimoku cloud for the ranging market condition within the following support/resistance levels:
- 1.3588 resistance level located near and above Senkou Span line which is the virtual border between the primary bearish and the primary bullish trend on the chart, and
- 1.3079 support level located in the beginning of the bearish trend to be resumed.
Chinkou Span line is located above the price indicating the ranging condition, Trend Strength indicator is estimating the trend as a bearish, and Absolute Strength indicator is evaluating the trend as a ranging. Anyway, non-lagging Tenkan-sen/Kijun-sen signal is for the bullish reversal, and the price is breaking symmetric triangle pattern to above for the open weekly bar for now.Trend:
W1 - ranging