The secret of the Ichimoku
Forum on trading, automated trading systems and testing trading strategies
Something Interesting in Financial Video May 2014
Sergey Golubev, 2014.05.12 08:54
Ichimoku Kinko Hyo Trading System
A brief look at the terminology, signals and methods for taking trades using Ichimoku Kinko Hyo.
More video on this subject:
- Ichimoku - about this indicator in general, what every line of this indicator means.
- Ichimoku cloud, how to use it with trading
- Ichimoku Trading - Ichimoku Training - Support and Resistance with the Ichimoku Cloud Trading
- Kumo Breakout Trading with the Ichimoku System.
- Ichimoku vs Moving Average Trade Analysis.
- Ichimoku vs Moving Average Trade Analysis
- Technical Analysis Course - Module 10: Cloud Charts: the Ichimoku Technique
- Ichimoku - Drawbacks Of Ichimoku Kinko Hyo
- Ichimoku - Ideal Ichimoku ScenariosIchimoku - Kumo Cloud Studies I
- Ichimoku - Multiple Confirmation
==============
Ichimoku threads/posts on mql5.com forum
- The theory of the signals
- Ichimoku alert indicator with arrows
- Ichimoku alert indicator improved : warning alert mode was fixed and autosettings feature was added
=============
Ichimoku indicator description
- Tenkan Sen - moving average of the highest high and lowest low over the last 9 trading days. (Highest high + Lowest low) / 2 over the last 9 trading days
- Kijun Sen - moving average of the highest high and lowest low over the last 26 trading days. (Highest high + Lowest low) / 2 over the last 26 trading days.
- Senkou Span A - the average of the Tenkan Sen and Kijun Sen, plotted 26 days ahead. (Tenkan Sen + Kijun Sen) / 2 plotted 26 days ahead
- Senkou Span B
- the average of the highest high and lowest low over the last 52 days,
plotted 26 days ahead. (Highest high + Lowest low) / 2 over the last 52
trading days plotted 26 days ahead.
- Chikou Span - the closing price plotted 26 days behind.
=============
Forum on trading, automated trading systems and testing trading strategies
Sergey Golubev, 2013.11.25 12:23
Ichimoku Cloud (based on The Definitive Guide to Trading Trends with Ichimoku Cloud article)
Many traders are asked what indicator they would
wish to never do without. The answer has never wavered as there is one
indicator that clearly illustrates the current trend, helps you time
entries, displays support and resistance, clarifies momentum, and shows
you when a trend has likely reversed. That indicator is Ichimoku Kinko
Hyo or more casually known as Ichimoku.
Ichimoku is a technical or chart indicator that is also a trend trading system in and of itself. The creator of the indicator, Goichi Hosada, introduced Ichimoku as a “one glance” indicator so that in a few seconds you are able to determine whether a tradable trend is present or if you should wait for a better set-up on a specific pair.
Before we break
down the components of the indicator in a clear and relatable manner,
there are a few helpful things to understand. Ichimoku can be used in
both rising and falling markets and can be used in all time frames for
any liquid trading instrument. The only time to not use Ichimoku is when
no clear trend is present.
Always Start With the Cloud
The cloud is
composed of two dynamic lines that are meant to serve multiple
functions. However, the primary purpose of the cloud is to help you
identify the trend of current price in relation to past price action.
Given that protecting your capital is the main battle every trader must
face, the cloud helps you to place stops and recognize when you should
be bullish or bearish. Many traders will focus on candlesticks or price
action analysis around the cloud to see if a decisive reversal or
continuation pattern is taking shape.
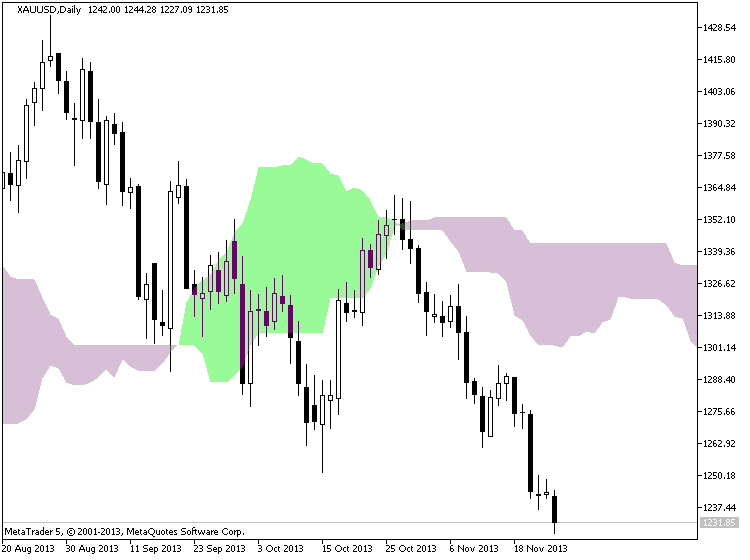
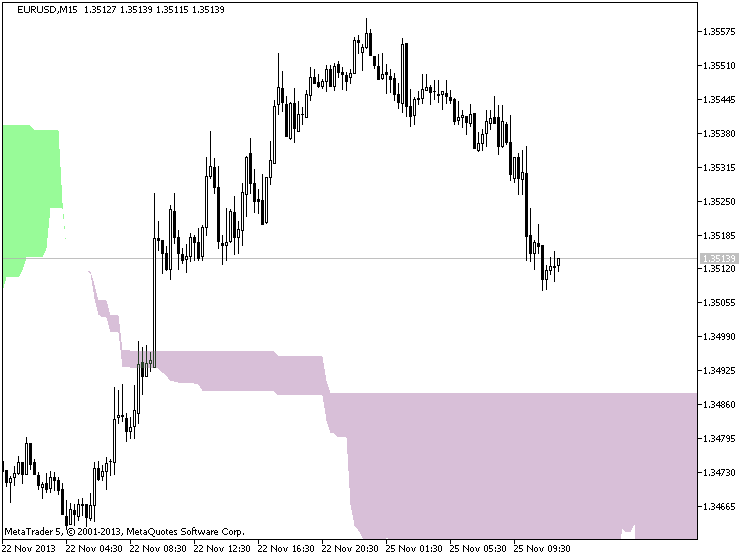
In the simplest terms, traders who utilize Ichimoku should look for buying entries when price is above the cloud. When price is below the cloud, traders should be looking for temporary corrections higher to enter a sell order in the direction of the trend. The cloud is the cornerstone of all Ichimoku analysis and as such it is the most vital aspect to the indicator.
Time Entries with the Trigger & Base Line
Once you have
built a bias of whether to look for buy or sell signals with the cloud,
you can then turn to the two unique moving averages provided by
Ichimoku. The fast moving average is a 9 period moving average and the
slow moving average is a 26 period moving average by default. What is
unique about these moving averages is that unlike their western
counterparts, the calculation is built on mid-prices as opposed to
closing prices. I often refer to the fast moving average as the trigger
line and the slow moving average as the base line.
The Ichimoku components are introduced in a specific order because that is how you should analyze or trade the market. Once you’ve confirmed the trend by recognizing price as being below or above the cloud, you can move to the moving averages. If price is above the cloud and the trigger crosses above the base line you have the makings of a buy signal. If price is below the cloud and the trigger crosses below the base line you have the makings of a sell signal.
Confirm Entries with the Mysterious Lagging Line
In addition to the mystery of the cloud, the lagging line often confuses traders. This shouldn’t be the case as it’s a very simple line that is the close of the current candle pushed back 26 periods. When studying Ichimoku, I found that this line was considered by most traditional Japanese traders who utilize mainly Ichimoku as one of the most important components of the indicator.
Once price has broken above or below the cloud and the trigger line is crossing the base line with the trend, you can look to the lagging line as confirmation. The lagging line can best confirm the trade by breaking either above the cloud in a new uptrend or below the cloud in a developing downtrend. Looking above, you can see that the trend often gathers steam nicely after the lagging line breaks through the cloud. Another benefit of using the lagging line as a confirmation indicator is that the lagging line can build patience and discipline in your trading because you won’t be chasing the initial thrust but rather waiting for the correction to play out before entering in the direction of the overall trend.
Trading With Ichimoku Checklist
Now that you know the components of Ichimoku here is a checklist that you can print off or use to keep the main components of this dynamic trend following system:
Ichimoku Checklist:
1.Where is Price in Relation to the Cloud?
- Above the cloud -filtered for buy only signals
- In the Cloud - be cautious but ready to jump in on the prior trend or finesse a current position. what the candle stick formations heavily
- Below the cloud - filtered for short only trades
2. Is price consistently on one side of the cloud or is price whipping around on both sides consistently?
- Ichimoku is best used with clear trends and should be set aside during ranging markets.
3. Which level of the Ichimoku would like to use to place your stop?
- If you use Ichimoku to place stops as well, you can either use the cloud or the base line.
Forum on trading, automated trading systems and testing trading strategies
Market Condition Evaluation based on standard indicators in Metatrader 5
Sergey Golubev, 2013.06.28 18:00
Hi zeno,
as to lower timeframe ... the default settings of Ichimoku is 9/26/52, right? But it is mainly for higher timeframe (started from H1 for example). For lower timeframe - there are 2 kinds of settings:
- 9/26/52 as default one and/or
- 72/144/288
=========
Besides, there are many signals of Ichimoku indicator to open the trades. I know about 6 signals (but it is much more signals in combination with each other):
- Tenkan Sen / Kijun Sen Cross - very weak signal but it is coming as the first one ... but it may be a lot of false signals
- price crossing Kijun Sen - more strong signal
- price crossing Sinkou Span A line (Kumo Breakout)
- price crossing Sinkou Span B line (Kumo Breakout)
- Senkou Span A crossing the Senkou Span B (trend reversal)
- Chikou Span crossing historical price - it is most strong signal for Ichimoku but it is lagging on timeframes started with H1, and not lagging for lower timeframes.
The combination of all those 6 signals = Ichimoku indicator.
So, the request about alert ... it is the request to create alet for all those signals with combination with each other? if yes so it is big project ... I do not have the credits in my profile for all those alerts (which may be - more than 100 different variations) :) ... if you are talking about some particular signal so - it may be possible to make alert.
I am mostly using on the thread just one signal : Chikou Span crossing historical price. So, which signal to be alert?
 1 secret
Forum on trading, automated trading systems and testing trading strategies
Something Interesting to Read February 2014
Sergey Golubev, 2014.02.25 16:46
Cloud Charts : Trading Successful with the Ichimoku Technique by David Linton
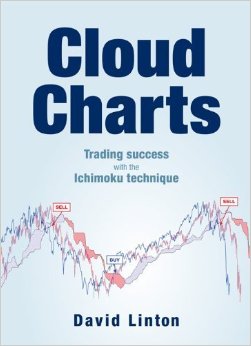
David Linton, the author of Cloud Charts, had his interest in Ichimoku
charts `sparked' during a presentation by Rick Bensignor at the 2004
IFTA conference in Madrid. David had heard of the method prior to the
conference but credits Rick with presenting it in an `understable' way.
David set out on a quest for Ichimoku knowledge. He researched the
internet, questioned Japanese delegates at subsequent IFTA conferences,
sought out Rick Bensignor at conferences and meetings and even flew to
Tokyo. The fruit of that quest is the book, Cloud Charts.
The Ichimoku method is now fast becoming popular in Western trading
rooms and is available on almost all technical analysis software. David
must take some credit for turning what seemed to be an exotic and
complicated method into an easily understandable and robust trading and
analysis tool for non-Japanese speaking technical analysts.
So, what is Ichimoku? The full name of the method is Ichimoku Kinko Hyo
which means 'at one glance balance bar chart'. Ichimoku charts were
devised by Goichi Hosoda , a Tokyo journalist, who believed that once
the method was fully understood, one could comprehend the exact state of
a market at a glance. Most of the Ichimoku indicators represent
equilibrium in one time frame or another and price action is generally
analysed with regard to whether the market is in equilibrium, moving
away from it or reverting back to it. By their nature, the various
indicators also offer dynamic areas of support or resistance.
Cloud Charts is divided into three parts. The first is for the novice
technical analyst and is designed to give them an understanding of many
basic technical analysis concepts involved with not only Ichimoku
analysis but also traditional techniques. More experienced technical
analysts may wish to skip this part.
Part two introduces the reader to the basic indicators used in Ichimoku
charts (David calls them cloud charts). This section deals with the
derivation and interpretation of:
1. The Turning Line (also called the Conversion Line)
2. The Standard Line ( also called the Base Line)
3. The Cloud Span A ( also called the Cloud Span 1)
4. The Cloud Span B (also called the Cloud Span 2)
5. The Lagging Line ( also called the Lagging Span)
Part two offers a guide to applying Ichimoku charts in a multiple time
frame sense, as well as the often overlooked Wave Principle, Price
Targets and Time Span Principle. However, the application of Ichimoku
charts to price and time projection is very subjective and for that
reason alone the projections are quite often not utilised by even
experienced analysts.
Looking at an Ichimoku chart, it's no surprise that analysts are
sometimes turned off by the busyness of the chart. It can look like
chaos to the uninitiated but the key to getting past that is
understanding the formula to each indicator, how they combine with each
other, how they represent a consensus of price action in different time
frames and colour-coding. In part two David explains construction and
interpretation of the charts in a manner that is easy for any newcomer
to technical analysis let alone a professional on a trading desk.
Part three, is where we are encouraged to think outside of the box.
Here, the use of Ichimoku charts are combined with other technical
analysis techniques, alternative time inputs into the indicators are
suggested and the application to market breadth analysis is considered.
There is also a chapter on back testing for the quantitative traders to
consume.
Overall, this book, in an easily read manner, brings together the body
of knowledge of a Japanese technical analysis method which was once
thought of as exotic and over-complicated. It has potential to become
the definitive English language text on the Ichimoku Kinko Hyo technical
analysis method.
Forum on trading, automated trading systems and testing trading strategies
USDJPY Technical Analysis 23.06 - 30.06 : Rally Finishing to Ranging
Sergey Golubev, 2013.06.27 12:07
Well ... what I am explaining here by text and charts - it is understandable for traders. But there are traders and coders on the forum. And I think we all know that they are using different "forex english" in some cases. So, I am just translating some terms/words I am using for technical Ichimoku analysis onto "coding english" language :) :
- Tenkan Sen - moving average of the highest high and lowest low over the last 9 trading days. (Highest high + Lowest low) / 2 over the last 9 trading days
- Kijun Sen - moving average of the highest high and lowest low over the last 26 trading days. (Highest high + Lowest low) / 2 over the last 26 trading days.
- Senkou Span A - the average of the Tenkan Sen and Kijun Sen, plotted 26 days ahead. (Tenkan Sen + Kijun Sen) / 2 plotted 26 days ahead
- Senkou Span B - the average of the highest high and lowest low over the last 52 days, plotted 26 days ahead. (Highest high + Lowest low) / 2 over the last 52 trading days plotted 26 days ahead.
- Chikou Span - the closing price plotted 26 days behind.
Second part of the TK Cross video explaining about the Kumo future as a filter on your cross.
==================
Tenkan Sen / Kijun Sen Cross
The Tenkan Sen / Kijun Sen Cross signal occurs when the Tenkan Sen (Turning line) crosses the Kijun Sen (Standard line).
A bullish signal occurs when the Tenkan Sen crosses from below to above the Kijun Sen
- A weak bullish signal occurs when the cross is below the Kumo.
- A neutral bullish signal occurs when the cross is inside the Kumo.
- A strong bullish signal occurs when the cross is above the Kumo.
- A weak bearish signal occurs when the cross is above the Kumo.
- A neutral bearish signal occurs when the cross is inside the Kumo.
- A strong bearish signal occurs when the cross is below the Kumo.
Kijun Sen Cross
The Kijun Sen Cross signal occurs when the price crosses the Kijun Sen (Standard line).
A bullish signal occurs when the price crosses from below to above the Kijun Sen
- A weak bullish signal occurs when the cross is below the Kumo.
- A neutral bullish signal occurs when the cross is inside the Kumo.
- A strong bullish signal occurs when the cross is above the Kumo.
- A weak bearish signal occurs when the cross is above the Kumo.
- A neutral bearish signal occurs when the cross is inside the Kumo.
- A strong bearish signal occurs when the cross is below the Kumo.
Ichimoku Trading for Beginners
- The theory of the signals
- Ichimoku alert indicator with arrows
- Ichimoku alert indicator improved : warning alert mode was fixed and autosettings feature was added
- Free trading apps
- Over 8,000 signals for copying
- Economic news for exploring financial markets
You agree to website policy and terms of use