Forecast and levels for Dow Jones Industrial Average - page 3


Forum on trading, automated trading systems and testing trading strategies

Press review

Sergey Golubev, 2017.09.18 16:32

Dow Jones Industrial Average  - All-Time Intraday Highs (based on the article)

H4 price broke Ichimoku cloud from below to above to be reversed back to the primary bullish market condition. The price crossed 22,275 resistance level for the bullish breakout to be continuing.


  • "The Dow Jones Industrial Average (22,275.02 on Sept. 15) set an all-time intraday high of 22,275.02 on Aug. 15. The weekly is positive with the average above its five-week modified moving average of 21,854.71. The 12x3x3 weekly slow stochastic reading rose to 76.31 last week, up from 74.26 on Sept. 8."
  • "Investment Strategy: Buy weakness to my quarterly value level of 20,327. My annual and semiannual pivots are 22,041 and 22,127, respectively. Sell strength to my weekly and monthly risky levels at 22,327 and 22,554, respectively."


Forum on trading, automated trading systems and testing trading strategies

Press review

Sergey Golubev, 2017.10.22 07:51

Dow Jones Industrial Average - The Week Ahead (based on the article)

Daily price is above 55 SMA/200 SMA revcersal levels in the bullish area of the chart: the price is testing Fibo resistance level at 23,316 to above for the bullish trend to be continuing


  • "The Dow Industrials led the market higher last week as it was up 2% compared to a 0.86% gain in the S&P 500 and only a 0.35% gain in the Nasdaq Composite.  The small cap Russell 2000 was up 0.44%. The weekly NYSE A/D numbers were positive with 1623 stocks advancing with 1433 stocks declining. Surprisingly they were not as strong as the previous week. The monthly chart of the SPDR Dow Jones Industrial (DIA) closed at $233.13 which was well above the monthly starc+ band for October at $228.57 (point 1). Based on current data the monthly starc+ band for November is at $233.02. The monthly starc- bands have been tested or exceeded several times in the past ten years but moves above the monthly starc+ bands are more rare. In reviewing the long term chart DIA closed the month of May 2007 at $106.02, point 1, which was above the monthly starc+ band at $104.58. The monthly starc+ band was also exceeded in July 2007 before the market corrected sharply into August."
  • "What about the week ahead?  The sentiment of the financial media is too bullish for my liking as one floor trader commented that the stock market was different this time. Believe me in over 35 years this is never the case and while that does not mean the market cannot still go higher the market is likely to eventually disappoint the majority. The newsletter sentiment data from Investors Intelligence indicates there are almost four times more bulls than bears which is a historically high level. To break this down 60% are bullish with just 15.2% bearish. In 2014 when the Bull/Bear ratio was also above 4.0 the market paused for a month before it again moved higher."

==========

The chart was made on D1 timeframe with standard indicators of Metatrader 4 except the following indicator (free to download):


Dow Jones - breakdown with the daily bearish reversal

Daily price was bounced from 26.698 resistance level to below for the correction with the bearish reversal: the price is testing 23,775 support level to below for the daily bearish trend to be continuing.

Dow Jones Breakdown

==========

Chart was made on MT5 with Brainwashing system/AscTrend system (MT5) from this thread (free to download) together with following indicators:

Same system for MT4:

  1. Brainwashing. Trades: manually and using EAs (MT4)
  2. Brainwashing EAs - the thread (MT4)
  3. Brainwashing: system setup for trading manually and for EAs (MT4) - the thread 
  4. Brainwashing: system development (MT4) - the thread
 

Seems Brainwashing system caught this recent movement  - 

Dow Jones chart by Brainwashing

============

Brainwashing System

The beginning

  1. Brainwashing. Trades: manually and using EAs (MT4)
  2. Brainwashing EAs - the thread (MT4)
  3. Brainwashing: system setup for trading manually and for EAs (MT4) - the thread 
  4. Brainwashing: system development (MT4) - the thread

After

  1. Brainwashing system/AscTrend system (MT5) - the thread 
============
 
Sergey Golubev:

Dow Jones - breakdown with the daily bearish reversal

Daily price was bounced from 26.698 resistance level to below for the correction with the bearish reversal: the price is testing 23,775 support level to below for the daily bearish trend to be continuing.


==========

Chart was made on MT5 with Brainwashing system/AscTrend system (MT5) from this thread (free to download) together with following indicators:

Same system for MT4:

  1. Brainwashing. Trades: manually and using EAs (MT4)
  2. Brainwashing EAs - the thread (MT4)
  3. Brainwashing: system setup for trading manually and for EAs (MT4) - the thread 
  4. Brainwashing: system development (MT4) - the thread

That crush !! no one could have anticipate that it will fall to to that extend.


Forum on trading, automated trading systems and testing trading strategies

Press review

Sergey Golubev, 2018.02.11 06:31

U.S. Stock Market: "That's All, Folks!" ... So soon? (based on the article)

Dow Jones Index daily price broke Ichimoku cloud to be reversed to the primary ebarish market condition as short-term situation for example.
By the way, it is just a secondary correction within the primary bullish trend in medium term (W1), and the strong bullish trend is still continuing in the long-term (MN1).

Dow Jones

  • "The U.S. stock market had a well-recognized, worry-inducing characteristic: An abnormally smooth ~50% rise over 12+ months. As was widely discussed in mid-2017, something had to give – there had to be a shakeup sometime. Because the common view was that stock prices were “too high,” expectations were that “sometime” was nigh. However, as the stock market is wont to do, the adjustment came months later, after the worries had dissipated and focus had shifted to Tax Bill optimism. “Correction” is the right label, but “entering a correction phase” is not. The U.S. stock market’s unusually fast drop looks to have done the job of curing latent worries and setting the stage for a bull market continuation."
  • "But what about rising interest rates and increasing inflation? Yes, we should expect those, but they are not worries for stock investors. Bond investors very much need to be concerned because both erode bond values. Not so with stocks. Rising rates and inflation (excluding “hyper” times) are positive signs of a growing economy and company earnings, thus driving stock prices higher."
  • "Regarding interest rates, remember that the Federal Reserve is nottightening credit by raising rates. Rather, it is finally moving away from its abnormally low rate controls and gradually allowing the financial markets to determine the appropriate level of interest rates – the process that has accompanied every other growth period and bull market in the past. ("Tightening" is when the Fed pushes rates higher than the markets have set them.)"
  • "The U.S. stock market’s sharp drop appears to be over. Growth fundamentals are intact, the too-steady/too-high worries are gone and the rising interest/inflation rates are positive accompaniments of growth, not reasons for further declines. Therefore, now looks to be a good time to buy/own U.S. stocks."

==========

The charts were made on MT5 with MA Channel Stochastic system uploaded on this post, and using standard indicators from Metatrader 5 together with following indicators:


Forum on trading, automated trading systems and testing trading strategies

Press review

Sergey Golubev, 2018.04.29 08:21

Dow Jones Industrial Average - daily bearish to be started; weekly ranging near bearish reversal (based on the article)


  • "The stellar earnings of last week from some of the largest companies could not move the market significantly higher as the major averages were mostly lower. Only the Dow Utilities were able to close the week with significant gains as it was up 2.5%."

==========

Chart was made on MT5 with Brainwashing system/AscTrend system (MT5) from this thread (free to download) together with following indicators:

==========

Same systems for MT4/MT5:

The beginning

  1. ASCTrend system, the beginning, part #1
  2. ASCTrend system, the beginning, part #2
  3. ASCTrend system, the beginning, part #3
  4. ASCTrend system, the beginning, part #4 
  5. Digital ASCTrend (Digital Filters with ASCTrend system combined).
  6. LabTrend (LabTrend indicators, LabTrendZigZag, templates, Labtrend EAs) - the thread 

After


Forum on trading, automated trading systems and testing trading strategies

Press review

Sergey Golubev, 2018.05.21 06:13

The Week Ahead: relatively quiet week (based on the article)

Dow Jones Industrial Average by Metatrader 5

  • "It will be another relatively quiet week as far as economic reports are concerned, although there is a possibility of a significant move following the FOMC meeting minutes on Wednesday or after the durable goods report on Friday."
  • "The market signals an almost 100% chance of a rate hike in June, and should the minutes turn out to be strongly dovish, a major “re-pricing” event could occur. While currencies and bonds would be the most affected, equities are also highly sensitive to rates. As the dollar’s recent rise caused a mini panic in emerging market assets, without real contagion into developed assets (yet…), a pullback in the currency would be much welcomed by investors. That said, the Gorilla thinks that the rising trend that started three weeks ago is intact, and that the benefit of the doubt is now on the side of bulls."
  • "It was a relatively quiet week concerning economic releases, but not so much for the bond market, as Treasury yields experienced wild swings across the curve. The moves were likely driven mostly by emotions, as the yield on the 10-year surged past 3%, since the economic outlook didn’t change radically. The retail sales report provided the biggest negative surprise, as both the headline and the core number came in below expectations. Housing starts also missed the consensus estimate, and while building permits were in line with expectations, the housing market seems to be losing its momentum yet again. On the flip side, industrial production beat expectations in April, and the better-than-expected Philly Fed and Empire State indices point to solid growth in manufacturing too."
  • "The technical picture remains encouraging for bulls, as the major indices seem to be on track to leave behind the 3-month long correction. The Dow, the S&P 500 and the Nasdaq are all above their 50- and 200-day moving averages, and thanks to the recent rally, the short-term indices are likely to turn higher again soon. Small caps are spearheading the recovery after a brief period of weakness, as the Russell 2000 took out its January high well ahead of the broader indices. The Volatility Index (VIX) closed at 13, near the weekly open, despite a spike to the 15 level on Tuesday, as the “boring” sessions that followed pushed the measure lower."

============

The chart was made on Metatrader 5 using HWAFM tool pattern tool from this post.


Forum on trading, automated trading systems and testing trading strategies

Press review

Sergey Golubev, 2018.06.08 06:51

Dow Jones Industrial Average  - daily bullish breakout; 25,316 is the key (based on the article)
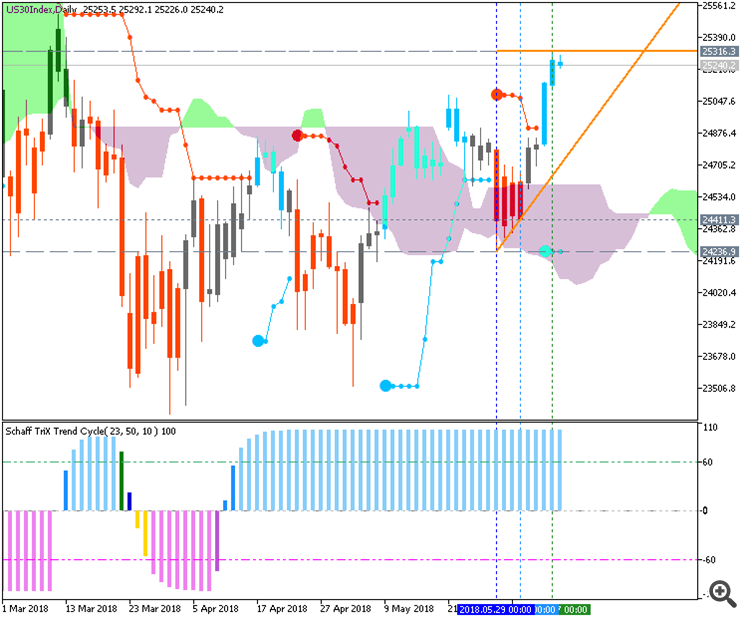
Dow Jones by MT5

  • "US stocks continue to show strength after the February pullback helped to build-in congestion formations across a number of indices. In the Dow, we looked at a bullish setup on Tuesday of this week, and prices have promptly took out both topside targets as buyers have continued to drive. This led to a bullish break of the symmetrical wedge formation that we've been following; along with a print of fresh two-month highs as buyers have remained in-control. "
  • "At this stage, those looking at longer-term strategies would likely want to await some element of pullback before looking to continue the move as the short-term formation here is quite stretched. The prior high could be of assistance, and this takes place at 25,078. This can be connected to the psychological level of 25,000 to produce a potential support zone that could be utilized on a pullback to open the door for bullish strategies."

==========

The chart was made on MT5 with Brainwashing system/AscTrend system (MT5) from this thread (free to download) together with following indicators:

Same system for MT4:

  1. Brainwashing. Trades: manually and using EAs (MT4)
  2. Brainwashing EAs - the thread (MT4)
  3. Brainwashing: system setup for trading manually and for EAs (MT4) - the thread 
  4. Brainwashing: system development (MT4) - the thread


Forum on trading, automated trading systems and testing trading strategies

Press review

Sergey Golubev, 2018.06.28 09:17

Dow Jones Industrial Average  - daily bearish reversal (based on the article)

D1 price broke 200 SMA to below for the bearish reversal to be started. The 55 SMA was not yet crossed with 200 SMA to below on close daily bar so the price may be bounced back to the bullish area soon.
Strategy: waiting for 55 SMA/200 SMA cross on daily chart together with 23,516 monthly last low as a support level for the final bearish daily reversal. 

Dow Jones daily chart by Metatrader 5

  • "The Dow Jones Industrial Average is the second-oldest stock index in existence, started in May of 1896 by Charles Dow and Edward Jones. Dow was an editor at the Wall Street Journal at the time, and his associate Edward Jones was a statistician looking for a simpler method of tracking market performance. The duo had created the Dow Jones Transportation Index in 1886 largely based around railroads, but as the US economy was becoming more industrialized they sought out a better way to gauge overall market performance and designed the Dow Jones Industrial Average around 30 industrial stocks. In the years since, the composition of the index has changed and that industrial connotation no longer applies as the index contains tech companies like Apple, IBM and Intel along with pharmaceutical companies like Merck and Pfizer."
  • "As a result of the Dow Jones Industrial Average tracking 30 of the largest, most established companies in the US economy, the index remains attractive for those looking to focus on larger blue chip stocks. This can be attractive when trends display themselves across an asset class, such as we've seen over the past nine years in stocks out of the United States since the Global Financial Collapse. This can help traders glean a bias in a market, so that shorter-term day trading strategies can be focused in the direction of the prevailing trend."
  • "One common way that traders measure or grade trends is with the 200 Day Moving Average. This is simply a 200-period moving average applied to the Daily chart, and when prices are above this level, traders can look at bullish strategies on shorter-term trading setups. Conversely, when prices cross-below this level, traders can then begin to look at bearish strategies under the expectation that prices may continue-lower."
  • "As a general rule, traders should look to cut their losses short while letting their winners run, and this remains the case whether it's a longer-term strategy, or a shorter-term day trading approach."

==========

The chart was made on MT5 with standard indicators of Metatrader 5 together with the following custom indicators: