Linear Regression Forecast formula or any Indicator?
cashcube: Is there any linear Regression forecast indicator available on MT4 platform. I tried using this, ViniI_LRMA_color.mq4 help me to share the correct linear regression forecast indicator or its formula? |
|
Thank you but Fitting parabola draws a channel. I required Linear Regression Forecast indicator which plotted nicely.
Thank you but Fitting parabola draws a channel. I required Linear Regression Forecast indicator which plotted nicely.
If you look at the formula of your linear Regression forecast indicator there is no linear regression it is only:
      tmp1=iMA(Symbol(),0,period,0,MODE_SMA,price,i);
      tmp2=iMA(Symbol(),0,period,0,MODE_LWMA,price,i);
      tmp3=3.0*tmp2-2.0*tmp1;
If you look at the formula of your linear Regression forecast indicator there is no linear regression it is only:
Agreed, well auther said, it is the faster method to calculate LR.
Is any true linear regression forecast indicator available on MT4 or any one even share me the formula.
Thank you.
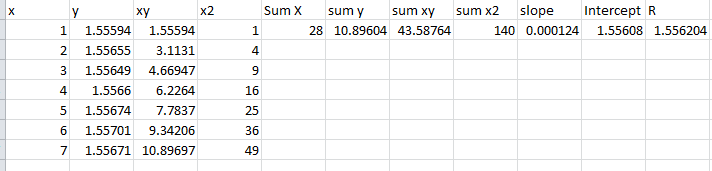
I tried to code any indicator with following formula:
Regression Equation(y) = a + bx
Slope(b) = (NΣXY - (ΣX)(ΣY)) / (NΣX2 - (ΣX)2)
Intercept(a) = (ΣY - b(ΣX)) / N
But it plottings things weirdly. Here Y = price, X = time in bar or sequence.
Here is the code:
#property indicator_chart_window;

#property indicator_buffers 1
#property indicator_color1 Blue
#property indicator_width1 2


//---- indicator parameters
extern int RegLin_Period=14;

//---- indicator buffers
double SLOPE;
double Data[];
double INTER;
double R;

//----
int ExtCountedBars=0;

//+------------------------------------------------------------------+

int init()
  {

      IndicatorBuffers(1);
      SetIndexStyle(0,DRAW_LINE);
      SetIndexDrawBegin(0,RegLin_Period);
      SetIndexShift(0,0);
      SetIndexBuffer(0,Data);

   IndicatorShortName("Linear Regression ("+RegLin_Period+")");

   return(0);
  }
//+------------------------------------------------------------------+

double slope(int iBar, int nBars)
{
   double sumy=0,
          sumx=0,
          sumxy=0,
          sumx2=0;

   int iLimit = iBar + nBars;

   for(; iBar < iLimit; iBar++)
      {
      sumy+=Close[iBar];
      sumxy+=Close[iBar]*iBar;
      sumx+=iBar;
      sumx2+=iBar*iBar;
      }

   return( (nBars*sumxy - sumx*sumy) / (nBars*sumx2 - sumx*sumx) );
}

//+------------------------------------------------------------------+

int start()

{
   int count = IndicatorCounted();

   if(count < RegLin_Period) count = RegLin_Period; // Lookback

   for(int iBar = Bars - 1 - count; iBar >= 0; iBar--)
     {
      SLOPE = slope(iBar, RegLin_Period);
      INTER = intercept(iBar,RegLin_Period);
      R = INTER + (SLOPE *Close[iBar]);
      Data[iBar] = R;
    // printf(DoubleToString(Data[iBar],5));
     }


 return(0);

}

//---------------------------------------------------------
double intercept (int iBar, int nBars)
{
   double sumy=0,
          sumx=0;

   int iLimit = iBar + nBars;

   for(; iBar < iLimit; iBar++)
      {
      sumy+=Close[iBar];
      sumx+=iBar;

      }

   return( (sumy - (slope(iBar, RegLin_Period))*sumx)/RegLin_Period );
}
     sumxy+=Close[iBar]*iBar;
      sumx+=iBar;
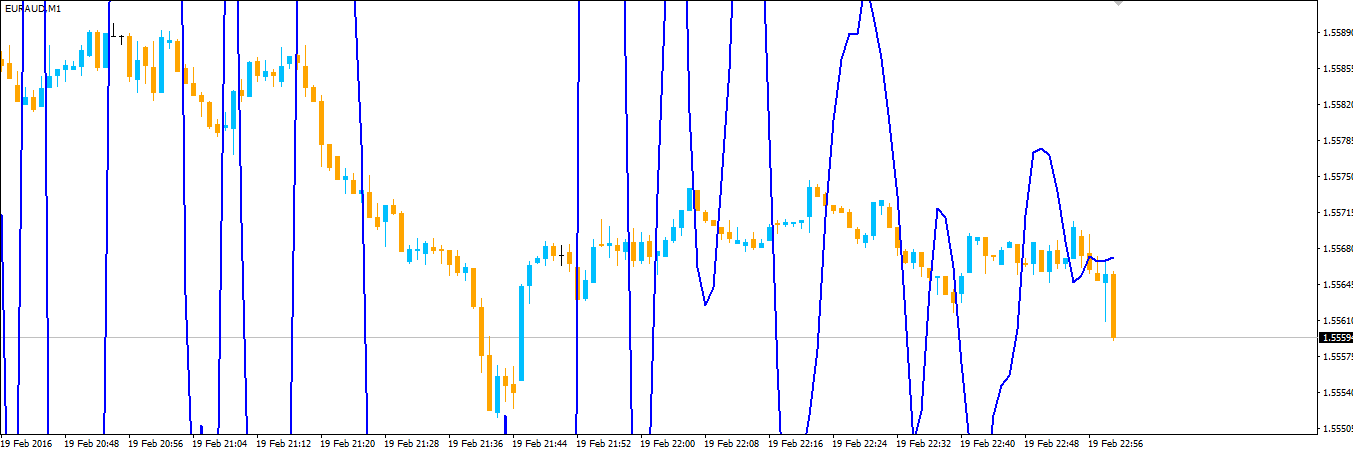
You are computing Close[X] = mX+B where X is the bar indexR = INTER + (SLOPE *Close[iBar]); Data[iBar] = R;
You are computing Line = mX+B where X is the bar close price, meaningless.
- You are computing Close[X] = mX+B where X is the bar index
- You are computing Line = mX+B where X is the bar close price, meaningless.
Thank you for your reply & spotting my mistake, I corrected 2nd one the followings:
 R = INTER + (SLOPE * iBar);
      Data[iBar] = R;
But its lines on my chart is still same? Why is that? It its plotting so weirdly.
This is an excel snapshot what I am trying to do: Sample 7
The original indicator is there, the line indicator derive from this one :
The original indicator is there, the line indicator derive from this one :
I actually derived it from regression slope & customized. The link you shared it's for the Linear Regression Channel not Linear Regression Forecast.
Plus Regression Channel is very straight drawing like a trendline line, not like the picture I posted at first.
- Free trading apps
- Over 8,000 signals for copying
- Economic news for exploring financial markets
You agree to website policy and terms of use
Hi,
Is there any linear Regression forecast indicator available on MT4 platform. I tried using this,
ViniI_LRMA_color.mq4
But it didn't plot correct curving after 270 period of LR.
I have two screen shot taken from LRF indicator & LRF indicator.
Both are completely different after 270 periods, it matches upto 270, but higher than it, curving is wrong on MT4.
This is the LRF for 450 period. Now metatrader 4 LRF for 450 period.
Look both are completely different. So please can anybody help me to share the correct linear regression forecast indicator or its formula?
Please help.
Thank you