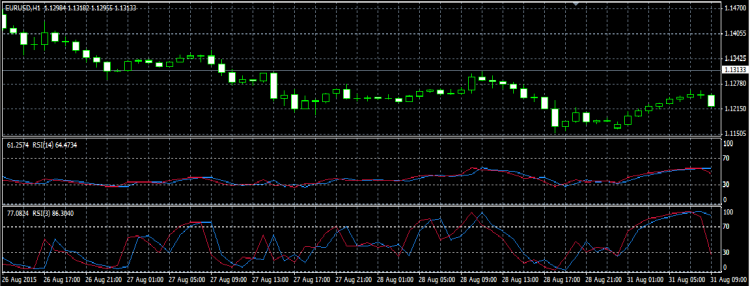
Why is there a difference between what and what?
In this picture the blue line is the result of the code.
iRSI(NULL, 60, 03, PRICE_OPEN, 0) - iRSI(NULL, 60, 14, PRICE_OPEN, 0)
What is done with this code? Is it assigned to a buffer?
I don't believe that the blue line is derived from this code as the result would have to be negative at times
Why is there a difference between what and what?
What is done with this code? Is it assigned to a buffer?
I don't believe that the blue line is derived from this code as the result would have to be negative at times
Hello again my friend.
There is a bit misunderstanding. The first part of the code drew the Bottom window and the one subtracted from it drew the upper window. I tried just putting the following code before and i got also some lag.
iRSI(NULL, 60, 03, PRICE_OPEN, 0)
Hello again my friend.
There is a bit misunderstanding. The first part of the code drew the Bottom window and the one subtracted from it drew the upper window. I tried just putting the following code before and i got also some lag.
In that case, you are comparing RSI 3 period with RSI 5 period
Probably the 14 you are comparing method open price with close price
In that case, you are comparing RSI 3 period with RSI 5 period
Probably the 14 you are comparing method open price with close price
Please Use this simple program in your strategy tester ,and then drag the corresponding RSI indicator to compare.
I want to compare maybe it has something to do with the PC or settings.
This is the result I got. I think it is lagging half an hour in this case.
I just need to read for example the RSI data of 4:00 at 4:01. Is there a simpler way?
- Free trading apps
- Over 8,000 signals for copying
- Economic news for exploring financial markets
You agree to website policy and terms of use

In this picture the blue line is the result of the code.
The red one is the result of dragging the RSI indicator to the chart.
Why is there a difference? Any ideas how to fix it?