nice idea..
anyone have this answer or solution?
You are missing trading opportunities:
- Free trading apps
- Over 8,000 signals for copying
- Economic news for exploring financial markets
Registration
Log in
You agree to website policy and terms of use
If you do not have an account, please register
does anyone have pivot point indicators for quarterly and half yearly levels or can any programmer modify yearly pivot to quarterly and half yearly pivot
dividing the year into four quarters the first begin at january and february and march and the second quarter include april and may and june and so on
quarterly pivot levels now should be calculated on this data highest price on the last three months of 2013 10/2013,11/2013,12/2013 and the lowest price of the last three months and close price is the close of 31/12/2013 these pivot levels should be on the chart until 31/3/2014 and change automatically on 1/4/2014 and soon and for the half yearly pivot from january to june is half and from july to december is the other half
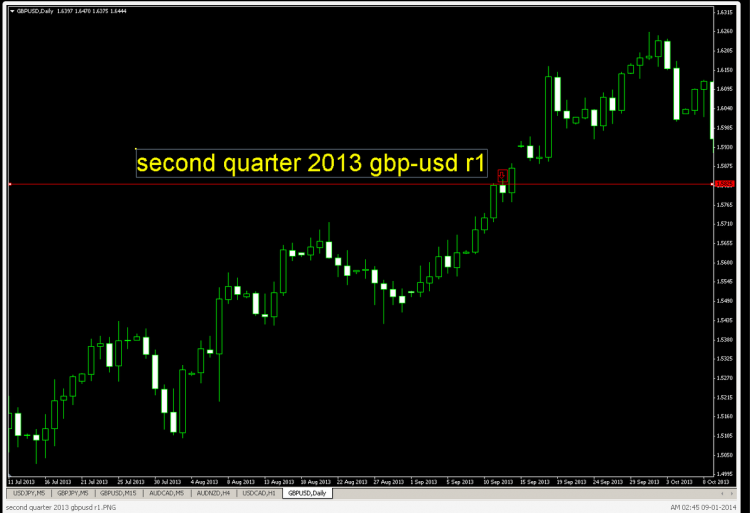
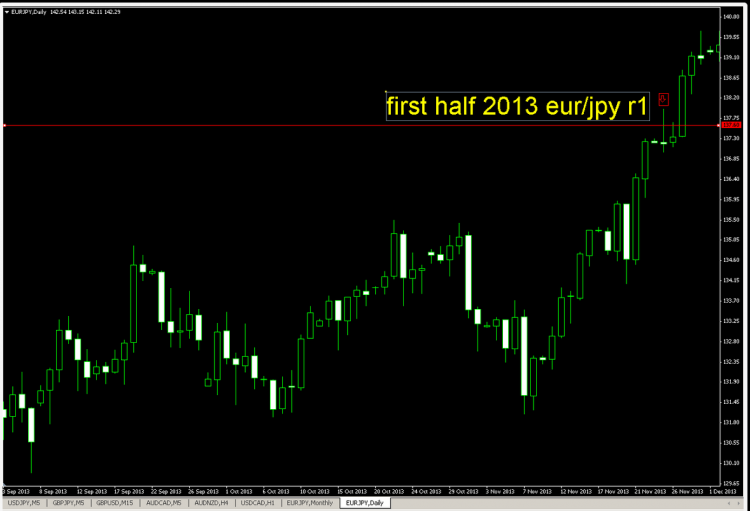
i already tried to calculate the quarterly pivot and half yearly for previous quarters and halves and find it very important and i captured some photos to show you how the market respect such levels
i explained it to convince any programmer to make it and if anyone will make this indicator i hope it make two possibilities show medians and change colors thanks
