a little help needed


Hello,

this code is supposed to caclulate the realtive lenght of the whick versus the body of the candle - and after that calculate and visualize an average for a short and a longer period of that

I am very new to coding (I suppose I couldn't hide it even if I wanted :)))))) ) - so please show me the errors and/or incompleteness :))))))))


#property indicator_separate_window
#property indicator_buffers 3
#property indicator_color1 Gray
#property indicator_color2 Blue
#property indicator_color3 Red
//--- input parameters
extern int    wantedbars = 20;
extern int    benchmarkbars = 2000;
//--- buffers
double currentbarvalue[];
double wantedcutvalue[];
double benchmarkvalue[];
//+------------------------------------------------------------------+
//| Custom indicator initialization function                         |
//+------------------------------------------------------------------+
int init()
  {
//---- indicators
   SetIndexStyle(0,DRAW_HISTOGRAM);
   SetIndexBuffer(0,currentbarvalue);
   SetIndexStyle(1,DRAW_LINE);
   SetIndexBuffer(1,wantedcutvalue);
   SetIndexStyle(2,DRAW_LINE);
   SetIndexBuffer(2,benchmarkvalue);
//----
   return(0);
  }
//+------------------------------------------------------------------+
//| Custom indicator deinitialization function                       |
//+------------------------------------------------------------------+
int deinit()
  {
//----
   
//----
   return(0);
  }
//+------------------------------------------------------------------+
//| Custom indicator iteration function                              |
//+------------------------------------------------------------------+
int start()
  {
   int    counted_bars=IndicatorCounted();
   for (int i=0; i<=Bars; i++) currentbarvalue[i] = MathAbs(Open[i]-Close[i])/MathAbs(High[i]-Low[i]+0.00000000000000000000000000000000000000000000000001);
   for (i=0; i<=Bars; i++) wantedcutvalue[i]  = iMAOnArray(currentbarvalue,0,wantedbars,0,0,0);
   for (i=0; i<=Bars; i++) benchmarkvalue[i]  = iMAOnArray(currentbarvalue,0,benchmarkbars,0,0,0);
   
//----
   
//----
   return(0);
  }
//+------------------------------------------------------------------+
 

the errors are about the moving averages - they both appear as horizontal lines (no matter the period)

0.0000000000000000000000000000000001 is to avoid dividing by zero and not complicate the code at the same time

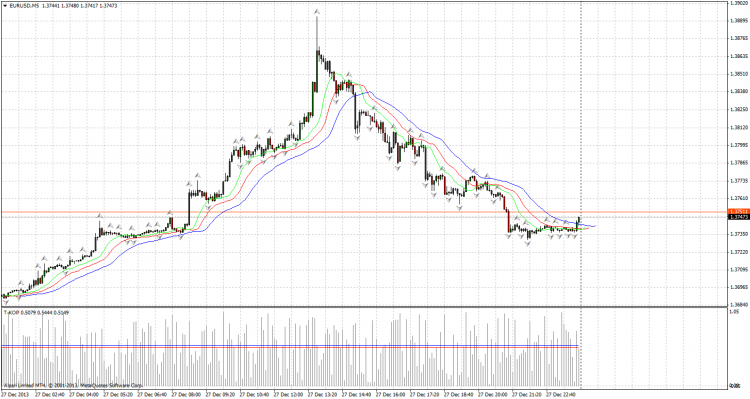
[img]http://charts.mql5.com/3/437/eurusd-m5-alpari-limited.png[/img]

 
  for (i=0; i<=Bars; i++) wantedcutvalue[i]  = iMAOnArray(currentbarvalue,0,wantedbars,0,0,0);
  for (i=0; i<=Bars; i++) benchmarkvalue[i]  = iMAOnArray(currentbarvalue,0,benchmarkbars,0,0,0);

Why do you want every arrayvalue filled with same result ??


the chart:


deVries:

Why do you want every arrayvalue filled with same result ??

thanks alot for the reply


I don't want that, actually... I thought that with that last zero I am not shifting anything...

 
thanks alot, deVries, with the "i" instead of the zero it looks quite correct :))))))))))))))))
 
ku43to: I thought that with that last zero I am not shifting anything...
Exactly. "Not shifting anything" means the same value.
Reason: