Dear Friends,
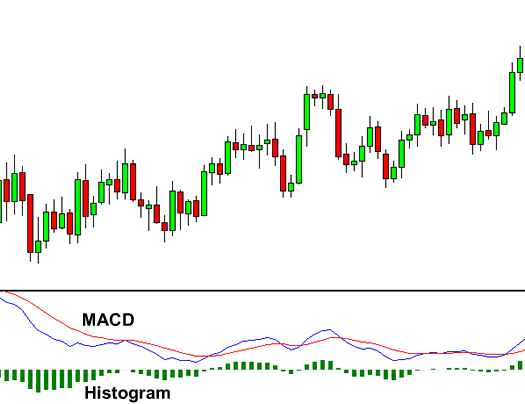
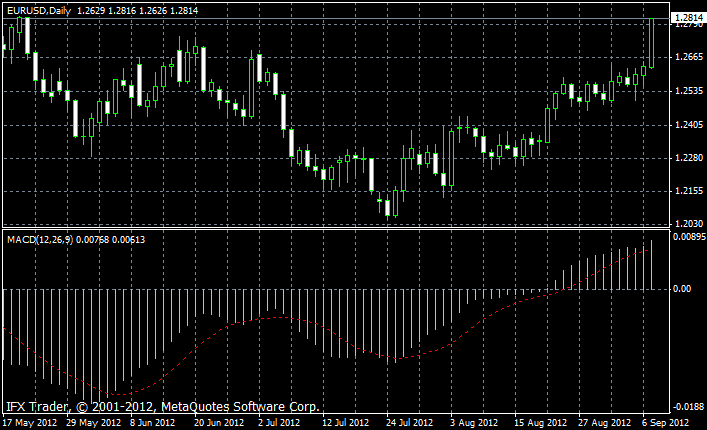
I have a problem, in putting MACD indicator to the chart. As shown in the picture, why can not appears 2 line and 1 histogram as in theory (babypips)?
Can anyone help me?
Sorry, my question may be very easy for some people, but I am still a newbie. thank you
Hi Jo_NewbieFx,
Try this one attached. You know where to put it don't you ?
![]()
Hi Jo_NewbieFx,
Try this one attached. You know where to put it don't you ?
Thank you,
Sorry, I actually want to ask what if I put a MACD indicator on the chart, did not appear and the first 2 lines MACD histogram as it should be based on theor
Thank you.
Thank you,
Sorry, I actually want to ask what if I put a MACD indicator on the chart, did not appear and the first 2 lines MACD histogram as it should be based on theor
Thank you.
Hi Jo_NewbieFx,
That because the MACD you put has only 1 histogram and 1 line and the one I attach has 1 histogram and 2 lines.
![]()
Hi Jo_NewbieFx,
That because the MACD you put has only 1 histogram and 1 line and the one I attach has 1 histogram and 2 lines.
Sorry, I'm still not clear ...
I drag MACD indicator from navigator window. There is no setting to make 2 line MACD. So I do not do the customization.
Sorry, are that process wrong?
Please help me !!
Thank you
Hi Jo_NewbieFx,
Try this one attached. You know where to put it don't you ?
It's been a long time since you sent this link. Just wanted to let you know I used it, it solved my identical problem. Thanks
- Free trading apps
- Over 8,000 signals for copying
- Economic news for exploring financial markets
You agree to website policy and terms of use
Dear Friends,
I have a problem, in putting MACD indicator to the chart. As shown in the picture, why can not appears 2 line and 1 histogram as in theory (babypips)?
Can anyone help me?
Sorry, my question may be very easy for some people, but I am still a newbie. thank you
