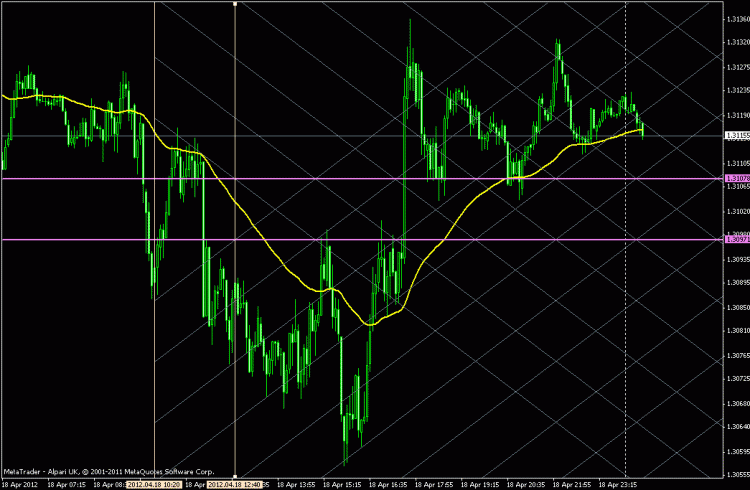
The file is smaller than the posted code; it does not contain the second loop.
(Copy/Pasted code) works ok for me (with intLimit=15) on this setup but fails when zoomed out fully.
I think what is happening is that you are relying on the ray feature but the two source points are too close together to get the required accuracy for the slopes and initial positions on the zoomed out chart. I bet that if you take your initial data points as they are but use 10x the separation between the ends of the trendlines, the problem will be reduced or eliminated. Doubles have plenty of resolution to use for the calculations.
//+------------------------------------------------------------------+
//|                                               test diagonals.mq4 |
//|                                                           Oneday |
//|                                                                  |
//+------------------------------------------------------------------+
#property copyright "Oneday"
#property link      ""
#property show_inputs
#include <stdlib.mqh>

extern   bool  blnDebug =  false;

//=============================================================================================================|
int start(){
   datetime dteT1    =  ObjectGet("T1",OBJPROP_TIME1);
   datetime dteT2    =  ObjectGet("T2",OBJPROP_TIME1);
   double   dblUpper =  ObjectGet("P1",OBJPROP_PRICE1);
   double   dblLower =  ObjectGet("P2",OBJPROP_PRICE1);
   double   dblRange =  (dblUpper - dblLower);
   double   dblY1;
   double   dblY2;

   if(blnDebug){
      Print("dblUpper: ",DoubleToStrMorePrecision(dblUpper,15));
      Print("dblLower: ",DoubleToStrMorePrecision(dblLower,15));
      Print("dblRange: ",DoubleToStrMorePrecision(dblRange,15));
   }

   int      intLimit =  25;
   dblY1    =  dblUpper - 10.0*dblRange;
   dblY2    =  dblUpper;
   dteT2    =  dteT1 + 10*(dteT2 - dteT1);

   for(int i = 0;i < intLimit; i++){
      ObjectCreate("diag:"+i,OBJ_TREND,0,dteT1,dblY2,dteT2,dblY1);
      ObjectSet("diag:"+i,OBJPROP_COLOR,SlateGray);
      ObjectSet("diag:"+i,OBJPROP_RAY,true);
      dblY1 += dblRange;
      dblY2 += dblRange;
      if(blnDebug){
         Print("diag:"+i+": dblY1: ",DoubleToStrMorePrecision(dblY1,15));
         Print("diag:"+i+"dblY2: ",DoubleToStrMorePrecision(dblY2,15));
      }
   }

   dblY1    =  dblLower + 10*dblRange;
   dblY2    =  dblLower;

   for(int j = 0;j < intLimit; j++){
      ObjectCreate("diagj:"+j,OBJ_TREND,0,dteT1,dblY2,dteT2,dblY1);
      ObjectSet("diagj:"+j,OBJPROP_COLOR,SlateGray);
      ObjectSet("diagj:"+j,OBJPROP_RAY,true);
      dblY1 -= dblRange;
      dblY2 -= dblRange;
      if(blnDebug){
         Print("diagj:"+j+": dblY1: ",DoubleToStrMorePrecision(dblY1,15));
         Print("diagj:"+j+"dblY2: ",DoubleToStrMorePrecision(dblY2,15));
      }
   }
   WindowRedraw();
   return(0);
}
Thanks Dabbler,
I was considering a similar workaround, although I will also need to alter the second time coordinate by multiples of the horizontal range too.
It would be nice if Metaquotes could improve the accuracy of the rays though...and add the option to project rays in both directions, as you can in MT5....
Cheers
- Free trading apps
- Over 8,000 signals for copying
- Economic news for exploring financial markets
You agree to website policy and terms of use


I am aware of the fact that there are issues with trendlines when changing timeframes, but surely they should plot accurately on the timeframe that they are created? Not in my experience! Perhaps it is my code:
I don't think so, but I could be wrong...
Looking at the code, you can see that what I am doing is plotting trendlines to create a diagonal grid. In each loop the time coordinates are constant and on each iteration the price coordinates are increased/decreased by the the difference in pips of the upper horizontal line and the lower horizontal line (the blue lines in the attached chart are the ones referred to in the objectget functions). So, as the price coordinates are increasing/decreasing by the same value on each iteration, they should plot parallel to each other and intersect their opposites at the junction with the vertical cycle lines, which I have used to indicate increments of half the width in bars between the two vertical lines used to define the time coordinates. Now, if you look at the attached image you will see that instead of intersecting where they ought to, they in fact drift out of position. Not all of them, but some of them. I have even seen two trendlines that are supposed to be parallel cross over each other!
So have I misunderstood something in the coding, or is this another bug...I would be grateful for any advice on this because it is extremely frustrating, after all, trendlines are a fundamental tool....