- Array resize bug in beta build 530
- Indicators: Impulse MACD
- Optimization with a twist...
My scambot
https://www.mql5.com/en/forum/137121/page4#560454
was based on the analysis of the last three M15 bars using 6 tests per bar
For each bar ...
1) was it rising?
2) did it close above the previous high?
3) was the high above the previous high?
4) was the low below the previous low?
5) was the new high rejected (long upper wick)?
6) was the new low rejected (long lower wick)?
The trouble is that I then had 18 binary tests = 2^18 = 262144 permutations, and that just curve-fits to the market very easily :-(
It seems nice to me!
Did you know that one of the richest traders from Japan before few years jumped (suicide) from skyscraper/building after he lost all his funds in one trade (in 5 minutes long-lasting trade) with that pattern, it was his favorite pattern over 10 years?
Woa - I would not risk that much in any one trade! I have built my funds to what it is today by using the 2% rule.
I am analysing a 2 bar relationship along with the position of the last closing bar. I am using the H1 time frame.
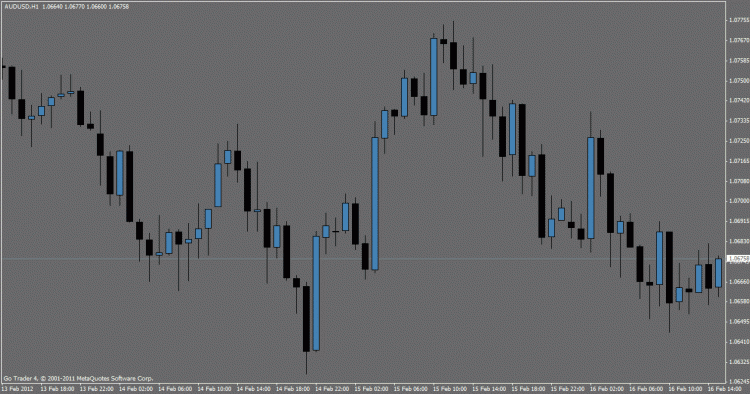
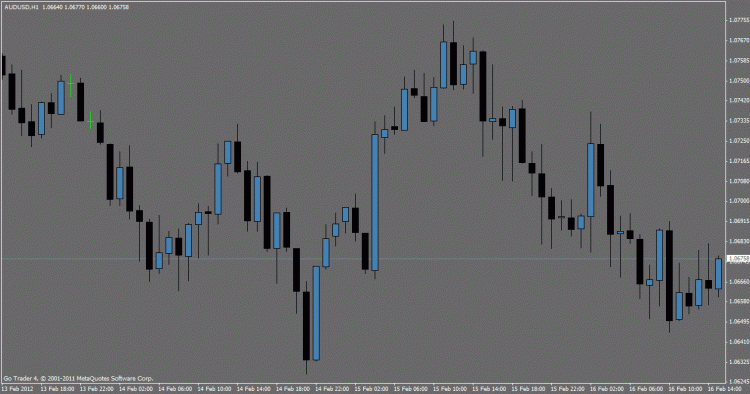
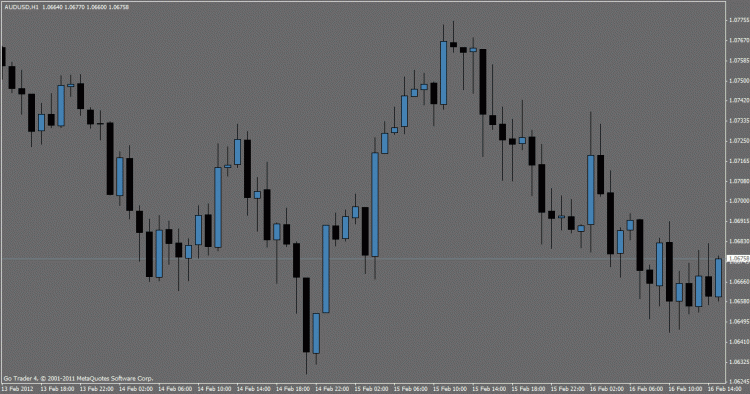
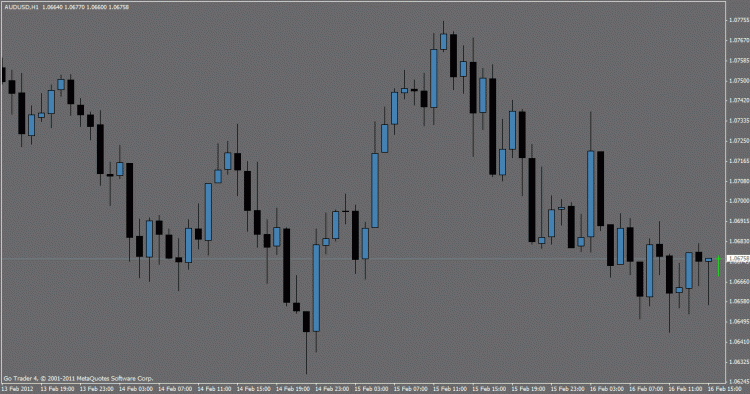
I have spend some time recently doing stuff with different types of bars . . . I recently made an observation that can be simply illustrated by a few charts . . .
The following charts all show EXACTLY the same data . . . . the data is the same and is from a single Broker.
The charts are completely different. How did you recalculate the bars?
I'll spill the beans a little later . . .
The first chart is the original H1. The rest are manufactured from the M1 data and each is shifted 10 mins from the one before, so H1, H1 + 10mins, H1+20mins, H1+30mins, etc.
I used this Indicator to create the offline charts that I took the chart grabs from: Improved multi-timeframe/offset/chart period converter, P4L PeriodCon.mq4 @ Forex Factory
- Free trading apps
- Over 8,000 signals for copying
- Economic news for exploring financial markets
You agree to website policy and terms of use


