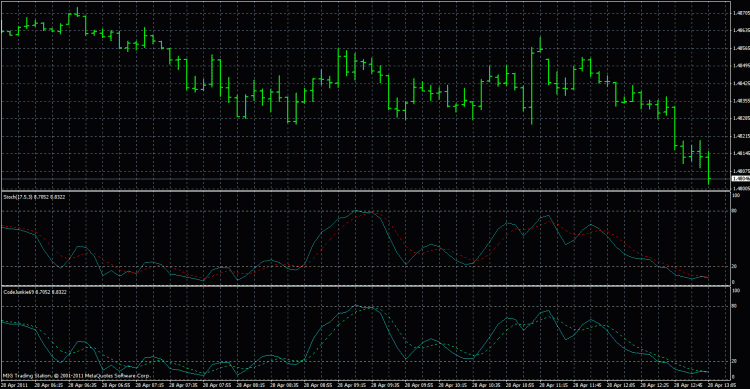
Different Values for standard Stochastic Oscillator indicator and iStochastic function with same parameters
I'm guessing either accuracy is not that big a deal with most chartist traders or nobody uses Stochastics. LOL.
If I ever find the answer I'll be sure to come back here and let all you interested parties know.
Well the last 2 days people were shouting "stochastic" and "williams" here so it started to interest me enough to check it out on the charts. Seems both are totally awesome tools for finding the "overbought" or "oversold" signals in trending charts, so I'd love to know what you find out.
I also apologise for hijacking your thread a bit, but I would like to find out from somebdy who tried both what his experience told him using these indicators.
Cheers o/
I'm guessing either accuracy is not that big a deal with most chartist traders or nobody uses Stochastics. LOL.
If I ever find the answer I'll be sure to come back here and let all you interested parties know.
Hi,
I'm quite new to mt4 myself.
just on a side note - not sure why you use once 2 and the other time 3 indicator buffers.
#property indicator_buffers 2

int init()
  {
//---- indicator line
   IndicatorBuffers(3);
Anyway: I use a lot of 'stochastic' and will writing a new Multi Timeframe one.
CodeJunkie69 seems that your example plots ok. put uses: Low/High
I guess the problem must be with https://docs.mql4.com/indicators/iStochastic
| price_field | - | Price field parameter. Can be one of this values: 0 - Low/High or 1 - Close/Close. |
You use:
PRICE_CLOSE
Try using 1
val1[pos] = iStochastic(NULL,0,k_param,d_param,slowing_param,MODE_LWMA,1,0,pos);
val2[pos] = iStochastic(NULL,0,k_param,d_param,slowing_param,MODE_LWMA,1,1,pos);
cheers
MJ
Interesting idea, I like it :) Would you mind letting us know what you find?
hi forexCoder,
MTF - Stochastic: I guess you might be interested in 'Spud's Predictive MTF Stochastic'. http://www.forexfactory.com/showthread.php?t=119483
- Free trading apps
- Over 8,000 signals for copying
- Economic news for exploring financial markets
You agree to website policy and terms of use

If I place the standard Stochatic Oscillator indicator directly onto a chart with a 17,5,3 using LWMA mode with CLOSE price I get the base and signal plotting just fine.
If I use an in-code call to iStochastic using EXACTLY the same parameters to plot what should be the same data - I get different values.
Attached is a screenshot showing the standard Stochastic Oscillator indicator in window 1 and the iStochastic in-code call plots in window 2. The settings are 17,5,3 using MODE_LWMA and PRICE_CLOSE. Even a cursory glance at the two plots show a number of obvious differences, but just check the current bar's values for each as shown in the upper left hand corner of each of the windows.
I have also attached the code used to plot the iStochastic.
Why do what should be identical methods of plotting the same curve using the same data yield different results?