Simple Custom Indicators using Math.
Did you try this?
Did you try this?
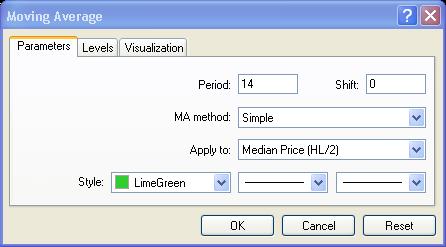
I did see that, thank you. Though, what I am looking for is simpler than that. I am just looking for the code to draw a line for each period that is the (h+l)/2. For the indicator I am working on, the period is always going to be one and I do not need any of the extra functionality of that indicator.
Ickyrus, I think that Boost is trying to develop his own indicators, and using the MA as an example where he can verify the results.
Boost, perhaps use the MACD example as a starting point, either looking closely at MacdBuffer (to use MT4-supplied price) or SignalBuffer (if using customised value)
Then again, Boost, if you were NOT aware of what Ickyrus mentioned, I suggest you do a lot of reading & exploring before diving in to writing custom indicators
Thanks all. I appreciate the input. I am just going to use the MA Ickyrus suggested and edit that.
It sometimes seems the trees are getting lost in the forest. Thanks again, brew and Icky!
I could also interpt what is wanted as drawing a horizontal line through the mid-point of each bar!
Looks like my assumption was wrong. Don't tell my family that; I tell them that the last time I was wrong was the year before last (although I might have been mistaken)
And yes, Ickyrus, you could be right; I've used SMA(1) in the past to do similar things!
- Free trading apps
- Over 8,000 signals for copying
- Economic news for exploring financial markets
You agree to website policy and terms of use
I am having a hard time trying to create a custom indicator by using math functions. I am trying to create a simple indicator that charts the median (H+L/2) price for each time period and then graph the line. I can not find any examples of indicators that does this simple function or any other simple math functions are created. Most of the indicators I can find are SMA's or other complex formulas. I would appreciate if anyone knows of one or can provide the code on how to draw a line on a chart for each time period by taking the average of the high for the period and the low for the period and creating a line.
Thanks for any help.