You are missing trading opportunities:
- Free trading apps
- Over 8,000 signals for copying
- Economic news for exploring financial markets
Registration
Log in
You agree to website policy and terms of use
If you do not have an account, please register
Weekly Outlook: 2018, January 21 - January 28 (based on the article)
The dollar remained on the defensive but it wasn’t one-sided anymore. The greenback fought back. GDP from the US and the UK, rate decisions in Japan and the euro, and many other events await us in a busy week. Here are the highlights for the upcoming week.

============
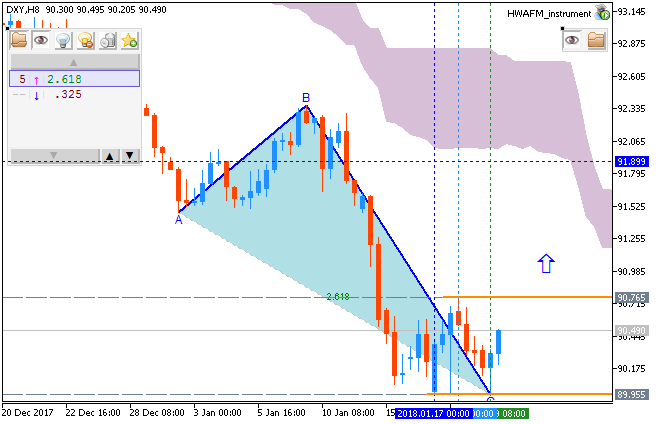
The chart was made on Metatrader 5 using HWAFM tool pattern tool from this post.
Stock Market Forecast For Jan 22-26 (based on the article)
EUR/USD - strong bullish on daily; 1.2323 is the key (based on the article)
Daily price is above Ichimoku cloud in the bullish area of the chart: the price is testing resistance level at 1.2323 together with ascending triangle pattern to above for the bullish trend to be continuing, otherwise - daily bullish ranging within the levels.
----------------
The chart was made on D1 timeframe with Ichimoku market condition setup (MT5) from this post (free to download for indicators and template) as well as the following indicator from CodeBase:
Bovespa Index - daily bullish breakout; 81,965 is the key (based on the article)
Daily price is on bullish breakout to be located above Ichimoku cloud: the price is testing the resistance level at 81,965 to above for the strong bullish trend to be continuing.
==========
The chart was made on W1 timeframe with standard indicators of Metatrader 4 except the following indicators (free to download):
Amazon - bullish breakout to be continuing if 1,339 resistance to be broken (based on the article)
Daily price is above Ichimoku cloud in the bullish area of the chart: the price is testing resistance level at 1,339 together with ascending triangle pattern to above for the bullish trend to be continuing.
----------------
The chart was made on D1 timeframe with Ichimoku market condition setup (MT5) from this post (free to download for indicators and template) as well as the following indicator from CodeBase:
IMF revises up world economic growth (based on the article)
Bitcoin - testing 10,083/8,771 support levels for the daily bearish breakdown to be continuing (based on the article)
Daily price broke Ichimoku cloud to below to be reversed to the primary bearish market condition: the price is on testing with support levels at 10,083 and 8,771 to below for the bearish breakdown to be continuing.
============
The chart was made on D1 timeframe with Ichimoku market condition setup (MT5) from this post (free to download for indicators and template) as well as the following indicators from CodeBase:
Bitcoin - weekly bullish ranging waiting for direction (based on the article)
The weekly price is above Ichimoku cloud for the bullish ranging within the following support/resistance levels:
Most likely scenario for the rest of January and whole the February: weekly bullish ranging within the levels.
============
Chart was made on MT5 with BrainTrading system (MT5) from this thread (free to download) as well as the following indicators from CodeBase:
All about BrainTrading system for MT5:
Bitcoin - sell at 8,771; run away at 2,644 (based on the article)
The weekly price is testing 8,771 support level to below for the secondary correction within the primary bullish trend to be started. By the way, the support level at 2,644 is the final level for the weekly bearish reversal in long-term situation for example.
==========
Charts were made on MT5 with Brainwashing system/AscTrend system (MT5) from this thread (free to download) together with following indicators:
==========
Same systems for MT4/MT5:
The beginning
After
Cryptocurrecy news: Crypto Hysteria Pushes GPU Prices Sky High (based on the article)
Ethereum/Usd intra-day price is ranging near and below Ichimoku cloud on the border between the primary bearish and the primary bullish trend on the chart.
If the price breaks 1,242 resistance to above so the price will be fully reversed to the primary bullish market condition.
If the price breaks 637 support level to below so the daily bearish reersal will be started with the weekly medium-tern secondary correction for example.
==========
Chart was made on MT5 with Brainwashing system/AscTrend system (MT5) from this thread (free to download) together with following indicators:
Same system for MT4: