This is the situation for H4 timeframe for now: price is ranging between support and resistance levels. Non-trading market condition for now.
MetaTrader Trading Platform Screenshots
MetaQuotes Software Corp., MetaTrader 5, Demo
eurusd h4 non-trading zone

This is bear market rally on D1 started:
MetaTrader Trading Platform Screenshots
MetaQuotes Software Corp., MetaTrader 5, Demo
bear market rally

Just about terminology ... we are talking on this thread about bear market rally? but what is that? well ... this is about trend in general:
Market Condition Evaluation based on standard indicators in Metatrader 5
newdigital, 2013.01.22 14:18
So, just to summarize few pages on this topic onto 1 comment:
1. Trend following
1.1. Primary trend
- Uptrend (bullish)
- Downtrend (bearish)
1.2. Secondary trend.
- Correction
- Bear Market Rally
2. Overbough/oversold ('top-and-bottom')
3. Breakout
There are some more: flat (or non-trading market condition), and ranging market condition. Some people say that flat and ranging are part of secondary trend together with correction and bear market rally; the other people are talking about flat and ranging as separated market condition which can be under item #4 (flat) and item #5 (ranging). I think, the true may be the following: flat and ranging are the part of secondary trend under trend following. If yes so the resultant classification may be the following:
1. Trend following
1.1. Primary trend
- Uptrend (bullish)
- Downtrend (bearish)
1.2. Secondary trend.
- Correction
- Bear Market Rally
- Flat (non-trading)
- Ranging
2. Overbough/oversold ('top-and-bottom')
3. Breakout
And this is the explanation about bear market rally
Market Condition Evaluation based on standard indicators in Metatrader 5
newdigital, 2013.01.02 16:10
1.2. Secondary trend.
Some people may ask:
"that is fine but what ... if signal line (dotted line) is above main line and both lines are fall but both lines are above level 50?"
Good question.
It is secondary trend.
There are many kinds of secondary trend but we will discuss Correction and Bear Market Rally.
This is Correction:
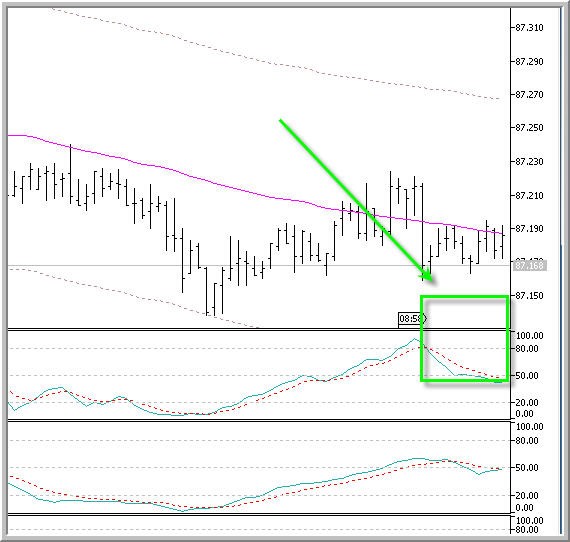
Correction is the following: it is still uptrend (all lines are above 50) but all the lines are moved on downtrend way. We will have downtrend when those lines will cross level 50 from above.
This is correction.
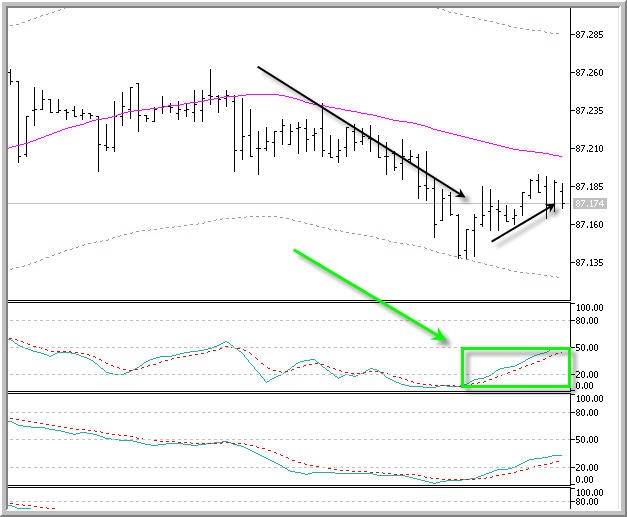
And this is Bear Market Rally:

And the next explanation:
Market Condition Evaluation based on standard indicators in Metatrader 5
newdigital, 2013.01.02 16:31
People are calling Correction and Bear Market Rally using just one word for both: correction.
Programmers are having different name for it: counter trend.
So, if someone is telling: "I have counter trend EA based on stochastic indicator" - we know what he is talking about.
There are some more kinds of secondary trend: non-trading, ranging and more.
But we will discuss it when we will make some explanation about divergence.
By the way, what is the most great indicator to estimate primary and secondary trend?
This is standard indicator in MT5:
MACD
============
Some people suggested to me to write some article about. But I am not ready yet. Besides, what I am explaining here is my practical knowlegde.
may be, later - I will write something.
More to follow.
So, to make it shorter:
- if we were reading something as "bearish correction" or bullish correction" so we know that it is about secondary trend (correction or rally).
- if someone is telling to us that he is using counter trend EA - we know that his EA is trading on secondary trend only (using correction or rally). Example with counter trend EAs? Famous EAs - DayTrading EA, Firebirth EA and some versions of Terminator EA, famous QQ EA (based on Momentum indicator) and so on. By the way, some versions of counter trend EAs participated in ATC (Championship) with some good results. So, what we are talking here theoretically - it was already programmed by coders many many years ago.
It was some information about terminology in market condition evaluation.
Articles? yes, may be ... i am travelling now so i will think about it when I come back home in the end of this week.
This is example what I was talking about counter trend:
- Phoenix_4_CONTEST indicator
- Interview with Harry Brinkhuis (he is famous coder and he used Phoenix EA which is public improvement of famous Firebird EA).
- Free trading apps
- Over 8,000 signals for copying
- Economic news for exploring financial markets
You agree to website policy and terms of use
The price was on bearish ranging inside Ichimoku cloud just for 2 days only last week and after that we saw good breakdown of all 4 support levels including last support (1.2916). EURUSD broke the border of the cloud (Sinkou Span A) and came to primary bearish zone of the chart.
This breakdown was slowly finished by last Friday but rally was not started yet. We can expect the primary bearish to be continuing with the correction (rally) somewhere in the middle of the week. If the price will cross 1.2843 support level on close bar so we can expect good downtrend to be continuing to this week.
UPCOMING EVENTS (high/medium impacted news events which may be affected on EURUSD price movement for the next week)
2013-05-21 06:00 GMT | [EUR - German Producer Price Index]
2013-05-22 08:00 GMT | [EUR - Current Account]
2013-05-22 14:00 GMT | [USD - Existing Home Sales]
2013-05-22 18:00 GMT | [USD - FOMC Meeting Minutes]
2013-05-23 14:00 GMT | [USD - New Home Sales]
2013-05-24 08:00 GMT | [EUR - German IFO Survey]
2013-05-24 12:30 GMT | [USD -Durable Goods Orders]
SUMMARY : Bearish
TREND : Bearish
Intraday Chart