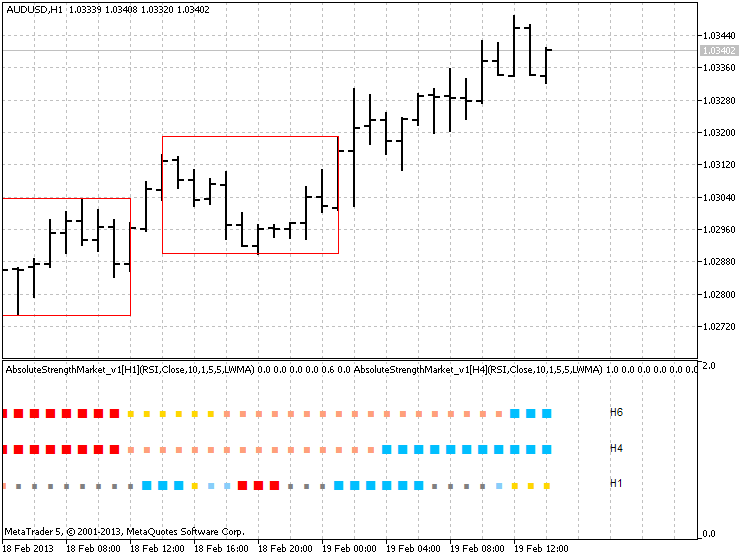
Hi,
Attached is a simple indicator to draw rectangles around ranging periods. You can define ranging period length and height. It maybe useful in visualizing ranging periods. There is still a little problem with deleting objects so sometimes they remain when they should not.
Br, Candles
Thanks Candles. Will try it out.
Complete the range. I talked about how to know when to know the range is over using two up candles or two down candles. I love range bars, but MT doesn't have them. Without range bars, in order to call the range "complete," I think that the best solution may be to wait until you have two consecutive up or down candles with a move that is at least 50% of the total span of the range.
hi
i have the same idea ... and so exited to see your article.
I'm training to write an expert based on it.
thank you :)
hi
i have the same idea ... and so exited to see your article.
I'm training to write an expert based on it.
thank you :)
Hi,
Attached is a simple indicator to draw rectangles around ranging periods. You can define ranging period length and height. It maybe useful in visualizing ranging periods. There is still a little problem with deleting objects so sometimes they remain when they should not.
Br, Candles
Do you have mq4/ex4 file of this indicator?
Sorry but I only have mq5/ex5 :(
CAN YOU PLEASE SHARE MQ5 IF YOU HAVE IT ?
THANX
Here is the updated version of my indicator for those who find it helpful. Report any bugs to me please.
Br, Candles

- www.mql5.com
Yes, it works

Yes, it works
- Free trading apps
- Over 8,000 signals for copying
- Economic news for exploring financial markets
You agree to website policy and terms of use
Many traders are great at trend trading and then get destroyed when price consolidates in a range. This is probably the main reason 95% of traders lose money.
After 7 years of getting chopped up in ranges myself I have a solution that is working for me as a discretionary trader, but the same principles should work with an EA.
I show this picture of the DOW because it is a perfect example of a range condition. I use the DOW to help me with FX correlations, but that is the subject of a different post.
1. IDENTIFY FLOOR AND CEILING. Notice the clearly defined tops and bottoms of the range. In this case it is a two week range on a 30 min chart. But these same principles can be applied to ANY time frame. The floor was formed after the retest at 13877 following a reversal off the high. The ceiling was formed at the retest at 14003. Now I have a range. Draw horizontal lines.
2. DRAW MID-LINE. Once the top and bottom of the range are defined, draw a mid-line.
3. MAGNETIZE. Notice the yellow midline acts like a magnet for price. Reversion to the mean is alive and well here for two solid weeks! And notice the many times the price bounced off the midline.
4. GO SHORT AT THE TOP AND LONG AT THE BOTTOM. Like with most envelope trading, we look for reversals at the extremes. But don't jump in front of the freight train! Wait until you see weakness on your stochastic or MACD or whatever you use to see a shift in momentum/cycle.
5. TAKE ONLY A FEW PIPS. This is the key to range trading that most traders are missing. When you take a short, don't wait to hit the floor. Get out at the "mid-line magnet" at the latest, preferably get out each time you make just a few pips, even if you haven't hit the mid-line yet.
6. WATCH FOR FALSE BREAKOUTS. Notice the false breakout up to 14046. The longer the range, the more violent the breakout. But that doesn't mean the BIG boys aren't waiting to feast. Be careful.
7. IDENTIFY A TRUE BREAKOUT. The range is over only when price continues to move outside the range. In this case if price had closed above the 14046 high again, I would say the range is over. Another way to do this is to use candles and look for two consecutive UP closes above the range, or two consecutive DOWN closes below the range.
Hope this helps!