CLineChart

A class for plotting curves.

Description

The methods included in this class are designed for working with curves on the chart. It features the ability to fill the area limited by the plotted curve.

ccanvas_linechart

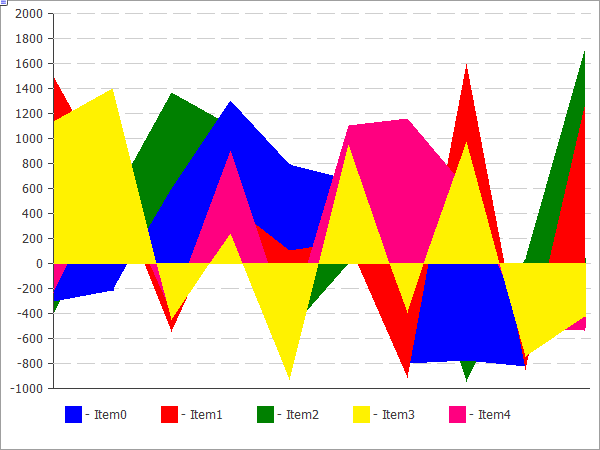
The code of the above figure is provided below.

Declaration

   class CLineChart : public CChartCanvas

Title

   #include <Canvas\Charts\LineChart.mqh>

Inheritance hierarchy

  CCanvas

      CChartCanvas

          CLineChart

Class methods

Method

Action

Filled

Sets the flag for filling the area under the curve defined by the data series.

Create

Creates a graphical resource.                                      

SeriesAdd

Adds a new data series.

SeriesInsert

Inserts data series to the chart.

SeriesUpdate

Updates data series on the chart.

SeriesDelete

Deletes data series from the chart.

ValueUpdate

Updates the specified value in the specified series.

DrawChart

Virtual method which draws a curve and all its elements.

DrawData

Virtual method which draws a curve for the specified series.

CalcArea

Calculates the area under the curve defined by the data series.

Methods inherited from class CCanvas

CreateBitmap, CreateBitmap, CreateBitmapLabel, CreateBitmapLabel, Attach, Attach, Destroy, ChartObjectName, ResourceName, Width, Height, Update, Resize, Erase, PixelGet, PixelSet, LineVertical, LineHorizontal, Line, Polyline, Polygon, Rectangle, Triangle, Circle, Ellipse, Arc, Arc, Arc, Pie, Pie, FillRectangle, FillTriangle, FillPolygon, FillCircle, FillEllipse, Fill, Fill, PixelSetAA, LineAA, PolylineAA, PolygonAA, TriangleAA, CircleAA, EllipseAA, LineWu, PolylineWu, PolygonWu, TriangleWu, CircleWu, EllipseWu, LineThickVertical, LineThickHorizontal, LineThick, PolylineThick, PolygonThick, PolylineSmooth, PolygonSmooth, FontSet, FontNameSet, FontSizeSet, FontFlagsSet, FontAngleSet, FontGet, FontNameGet, FontSizeGet, FontFlagsGet, FontAngleGet, TextOut, TextWidth, TextHeight, TextSize, GetDefaultColor, TransparentLevelSet, LoadFromFile, LineStyleGet, LineStyleSet

Methods inherited from class CChartCanvas

ColorBackground, ColorBackground, ColorBorder, ColorBorder, ColorText, ColorText, ColorGrid, ColorGrid, MaxData, MaxData, MaxDescrLen, MaxDescrLen, AllowedShowFlags, ShowFlags, ShowFlags, IsShowLegend, IsShowScaleLeft, IsShowScaleRight, IsShowScaleTop, IsShowScaleBottom, IsShowGrid, IsShowDescriptors, IsShowPercent, ShowLegend, ShowScaleLeft, ShowScaleRight, ShowScaleTop, ShowScaleBottom, ShowGrid, ShowDescriptors, ShowValue, ShowPercent, LegendAlignment, Accumulative, VScaleMin, VScaleMin, VScaleMax, VScaleMax, NumGrid, NumGrid, VScaleParams, DataOffset, DataOffset, DataTotal, DescriptorUpdate, ColorUpdate


Example

//+------------------------------------------------------------------+
//|                                              LineChartSample.mq5 |
//|                   Copyright 2009-2017, MetaQuotes Software Corp. |
//|                                              http://www.mql5.com |
//+------------------------------------------------------------------+
#property copyright   "2009-2017, MetaQuotes Software Corp."
#property link        "http://www.mql5.com"
#property description "Example of using line chart"
//---
#include <Canvas\Charts\LineChart.mqh>
//+------------------------------------------------------------------+
//| inputs                                                           |
//+------------------------------------------------------------------+
input bool Accumulative=false;
//+------------------------------------------------------------------+
//| Script program start function                                    |
//+------------------------------------------------------------------+
int OnStart(void)
  {
   int k=100;
   double arr[10];
//--- create chart
   CLineChart chart;
//--- create chart
   if(!chart.CreateBitmapLabel("SampleHistogrammChart",10,10,600,450))
     {
      Print("Error creating line chart: ",GetLastError());
      return(-1);
     }
   if(Accumulative)
     {
      chart.Accumulative();
      chart.VScaleParams(20*k*10,-10*k*10,20);
     }
   else
      chart.VScaleParams(20*k,-10*k,15);
   chart.ShowScaleTop(false);
   chart.ShowScaleRight(false);
   chart.ShowLegend();
   chart.Filled();
   for(int j=0;j<5;j++)
     {
      for(int i=0;i<10;i++)
        {
         k=-k;
         if(k>0)
            arr[i]=k*(i+10-j);
         else
            arr[i]=k*(i+10-j)/2;
        }
      chart.SeriesAdd(arr,"Item"+IntegerToString(j));
     }
//--- play with values
   while(!IsStopped())
     {
      int i=rand()%5;
      int j=rand()%10;
      k=rand()%3000-1000;
      chart.ValueUpdate(i,j,k);
      Sleep(200);
     }
//--- finish
   chart.Destroy();
   return(0);
  }