Watch how to download trading robots for free
Find us on Facebook!
Join our fan page
Join our fan page
You liked the script? Try it in the MetaTrader 5 terminal
- Views:
- 24998
- Rating:
- Published:
- 2010.07.13 13:24
- Updated:
- 2014.04.21 14:54
-
 You are missing trading opportunities:
- Free trading apps
- Over 8,000 signals for copying
- Economic news for exploring financial markets
Registration Log inYou agree to website policy and terms of use
If you do not have an account, please register -
 Need a robot or indicator based on this code? Order it on Freelance
Go to Freelance
Need a robot or indicator based on this code? Order it on Freelance
Go to Freelance
Author:
Diego Alonso Vallejo Duque
Descripción:
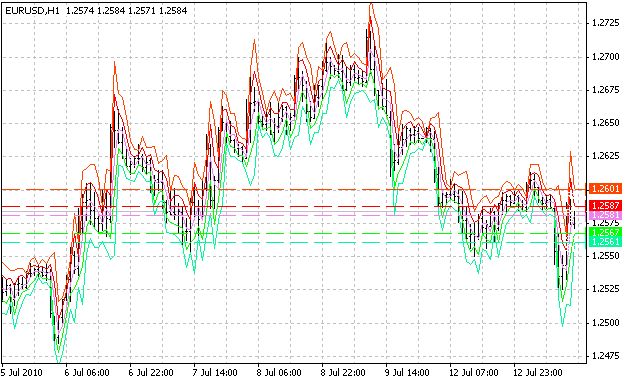
Indicator that shows two resistance levels, 2 levels of support and pivot, they calculated the traditional way.
The variable Last indicates the last bar to be analyzed, the time variable indicates the longer period to see
- 1 - min
- 2-5 min
- 3-15 min
- 4-30 minutes
- 5-1 h
- 6-4 h
- 7-1 d
- 8-1 w
Image:
 RSI Peak & Bottom
It showed the peak/bottom at rsi14
 Daily Opening EA (needs improvement ideas!)
A slightly different EA based off daily opening breaks.
Average Change V 0
This is the basic version of the Average Change indicator
Big Times
This indicator reflects the positive difference between the High and Low of the period.