Join our fan page
- Views:
- 52436
- Rating:
- Published:
- 2010.03.29 09:33
- Updated:
- 2016.11.22 07:32
-
Need a robot or indicator based on this code? Order it on Freelance Go to Freelance
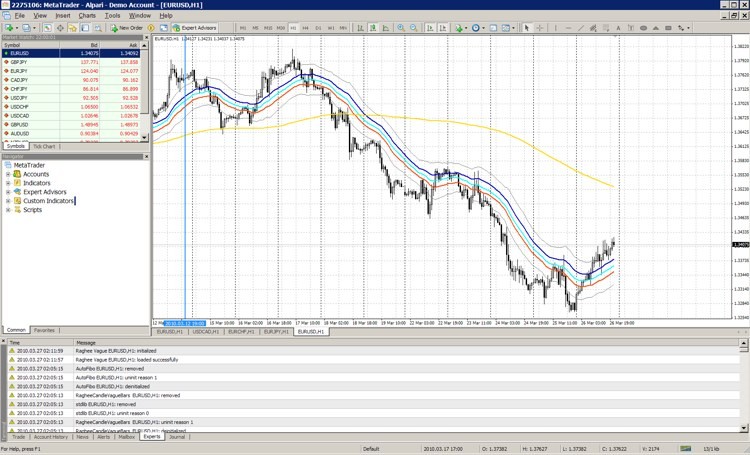
Raghee Vague: plot the three EMA34 and SMA200 used in the Raghe Method

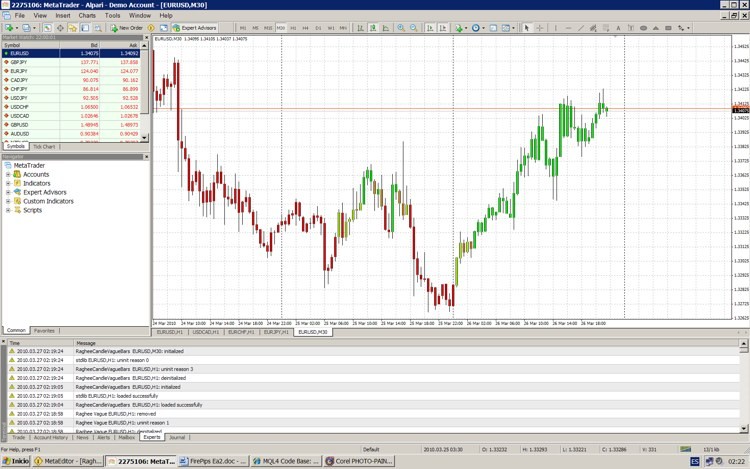
RagheeCandleVagueBars : plot colored candle bar: red for down trend (Raghee Vague < - 30º ), green bar for up trend (Raghee Vague > 30 º) and orange and chartreuse for neutre ( Raghe Vague between -30º and 0 or between 0 and 30º)

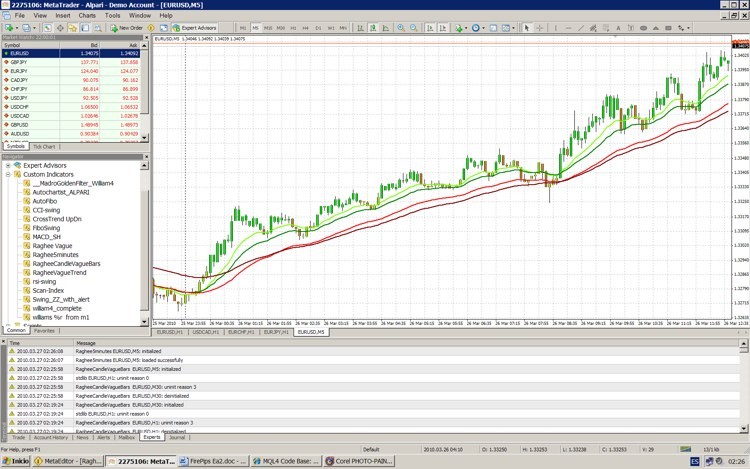
Raghee5minutes : plot three EMA for the Raghee 5 minutes method and change automaticaly with the trend.

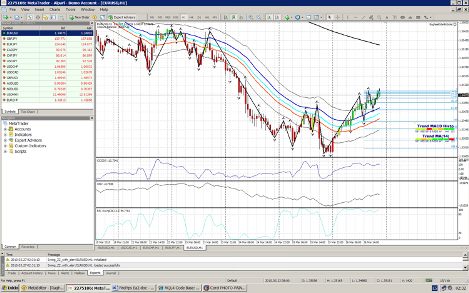
My complete windows use
my three indicators plus
- Fractals
- Swing_zz_with_alert
- Scan-Index
- FiboSwing
- CCI(20)
- OBV
- RSI-Swing(34,13,3)

Recommendations:
- read the Raghee blog for understand Raghee Horner method http://ragheehorner.com/blog/
 Higher TimeFrame Trend Indicator
This indicator displays on the current (lower) timeframe the overall trend on a higher timeframe. It also displays & alerts RSI overbought oversold conditions.
 Send a notification to your ICQ, MSN, AIM,... contacts
In conjunction with Miranda IM, you can use this library to control your Mirand IM client. E.g. Send and receive messages, set the status, read the contact list, etc..
 Market Way
This indicator combines the best traditions of oscillators and indicators for tracking the trend
 Another VSA indi.
VSA is about reading the market and mapping it out to give you a better understanding of what it might do next.