Join our fan page
- Views:
- 23907
- Rating:
- Published:
- 2009.11.22 21:19
- Updated:
- 2014.04.21 14:54
-
Need a robot or indicator based on this code? Order it on Freelance Go to Freelance
I often see people post "equity" curves from the backtester, showing only smooth lines and ignoring any drawdown between opening and closing a trade. Since MetaTrader only plots a new datapoint in the equity plot when a trade is closed, you simply can not get realistic plots. Also the time is completely missing, the x axis shows the number of trades and does not draw a clear picture of the time you would have waited. In general the equity plots produced by the backtester always tend to look much nicer than they really are.
This is about to change now!
Attached is a library that will allow you to produce realistic plots of the total equity (the only important number) versus time. The plots are saved as offline charts, you can view and analyze them just like ordiary charts.
Put the library into the include folder, include it in your EA and on every tick you call the function recordEquity() with name, period and magic number. Thats all!
The function can also be used to create plots of manual or automated trading in real time filtered by magic number and/or comment string. Use it to monitor the individual performances of your concurrently running EAs in separate charts. When in backtesting mode the name of the chart file will always be prepended with an underscore, so it doesn't interfere with the live chart the same EA may have already produced over time.
If you want to make a plot of closed source EAs or of your manual
trading then simply create an indicator with recordEquity() calls for
every magic number or comment string you want to record in the start()
function and attach it to any chart:
Example code for using this library in such an indicator would look like this:
//+------------------------------------------------------------------+
//|                                              equity_recorder.mq4 |
//|                                                     Bernd Kreuss |
//|                                                    7ibt@arcor.de |
//+------------------------------------------------------------------+
#property copyright "Bernd Kreuss"
#property link      "mailto:7ibt@arcor.de"

#property indicator_chart_window

#include <offline_charts.mqh>

/**
* the following will record 4 equity charts.
* attached to *any* chart (no matter which) this indi will on every tick
* calculated the profits, filter them by magic and comment and write
* them each into their own chart.
*/
int start(){
   // all trading, whole account
   // produce a dayly chart the with name "all" for it
   recordEquity("all", PERIOD_D1, -1);

   // all manual trading (magic = 0)
   // produce a dayly chart with the name "all_manual" for it
   recordEquity("all_manual", PERIOD_D1, 0);

   // only manual trading with a comment of "foo" in the orders.
   // Note that in this example we use an additional parameter
   // to filter all manual trades by their comment string.
   // It will match all trades beginning with, ending with
   // or containing the word "foo".
   // Produce a dayly chart with the name "fooStrat" for it
   recordEquity("fooStrat", PERIOD_D1, 0, "foo");

   // record the equity of the expert advisor with the magic number of 1234
   // produce an H1 chart with the name "scalperEA" for it
   recordEquity("scalperEA", PERIOD_H1, 1234);
}
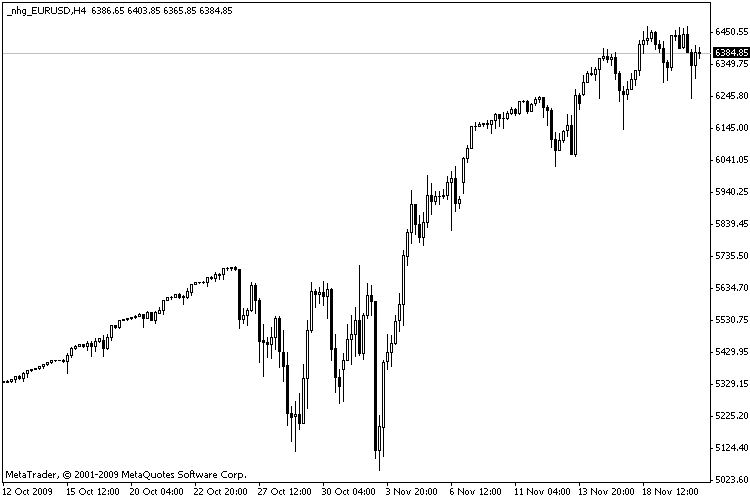
Attached is an image of an example plot. It is a simple grid system and the above library was used in the EA to create this equity chart:

Example Plot
 wajdyss_Account_Information_Indicator_V1
This indicator for show most information about your account like : number , name , company , leverage , etc .
 Hedge Script
Creates a synthetic Hedge for any open position that you select. Use it only if are you completely understand synthetic derivatives or triangular arbitrage.
 SAR Oscillator
Just Close - Parabolic SAR
 Stochastic with Noise Reduction
It reduces a lot of false signals using sensitivity tuning.
