Join our fan page
- Views:
- 48787
- Rating:
- Published:
- 2009.11.12 09:53
- Updated:
- 2016.11.22 07:32
-
Need a robot or indicator based on this code? Order it on Freelance Go to Freelance
Description:
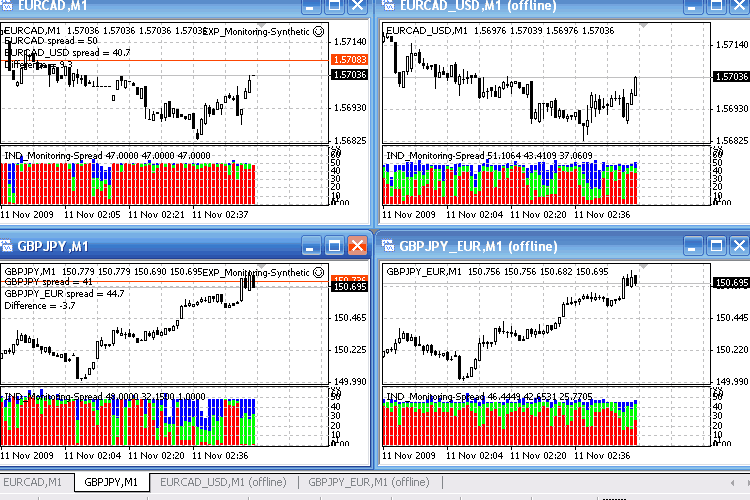
Indicator shows a histogram (the idea is not mine) with minimal (red), average (green) and maximal (blue) spread values on the corresponding bars.
Such monitoring is very useful for broker's spread compare and for spread dynamics analysis.
Image:

Fig 1. Indicator's work for real and synthetic currency pairs. Broker X.
The information collected doesn't lost after the indicator's delete and can be shown again after attaching to the chart.
Also indicator has a feature to visualize a spread for synthetic currency pairs.

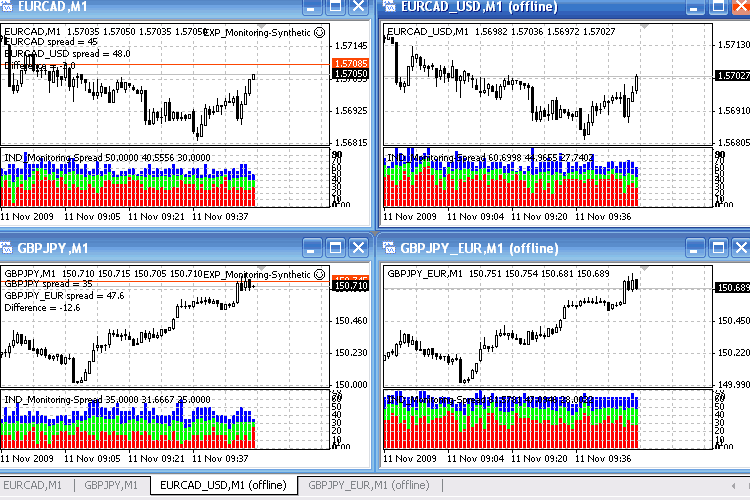
Fig 2. Indicator's work for real and synthetic currency pairs. Broker Y.
Recommendations:
To use synthetic currency pairs, do the following steps:
- Run the attached EXP_Monitoring-Synthetic expert on a real pair (as synthetics). It is necessary specify the currency (Currency property), which will be used for the synthetic pair calculation;
- Open the offline-chart for the constructed (XXXYYY_ZZZ) synthetic pair (chart will be updated automatically with the any new bar);
- Attach the IND_Monitoring-Spread indicator to the opened offline-chart;
On the figures presented above on the right side there is a synthetic pairs
EURCAD (through USD, using the EURUSD and USDCAD) and GBPJPY (through EUR,
using the EURGBP and EURJPY).
On each of these pairs the IND_Monitoring-Spread indicator shows spread dynamics of the corresponding synthetic pair. For the strategy testing of the synthetic paris there is an
opportunity to use them in the Strategy Tester, as real. So the generated historical data and spread characteristics of the synthetic pairs can be used further.
The expert EXP_Monitoring-Synthetic is an expert of loopback type, so it can be run as a
script (when you close the terminal script is automatically removed
from the chart). Also, as the indicator above, the expert does not
lose the collected historical data of synthetic pairs.
The proposed code can be modified to perform a real time update of the offline-chart, but it would require a more computing resources than for the current version, which updates occurs with a new bar. Note that for auto-update of the offline charts you should allow DLL use in your client terminal.
Editor's remark:
Note that it's a mirror translation of the original Russian version.
If you have any questions to the author, suggestions or comments, it's better to post them there.
If you have found this code useful for trading or educational purposes, don't forget to thank author.
Translated from Russian by MetaQuotes Ltd.
Original code: https://www.mql5.com/ru/code/9324
 StatementToGraph
Graphic displaying of the statement, carring of a data from the *.htm table to the graph, for the convenience of analysis.
 LineMA
Indicator shows color lines between two MA crosses
 MACD-STOCH Trader
EA based on MACD and STOCH. It will be helpful, if you test this EA with other currencies and report me, thx.
 Balance. A brief information about balance and positons
The indicator shows current balance and positions on the chart