Join our fan page
- Views:
- 34135
- Rating:
- Published:
- 2008.12.22 07:27
- Updated:
- 2014.04.21 14:53
-
Need a robot or indicator based on this code? Order it on Freelance Go to Freelance
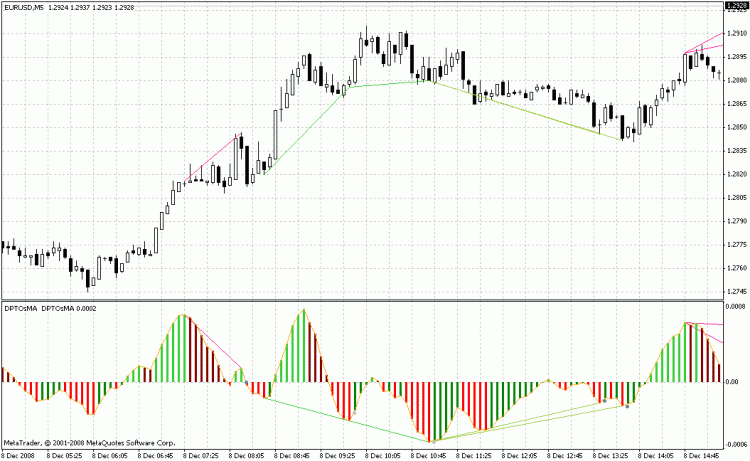
Colored OsMA and OsMA that shows the divergences.
You should open the «ind_OsMAColored_v1» indicator and then drag the «OsMA_Divergence_v1» indicator to the same window using the mouse. The gray points are more significant, it works on the 5M best of all, but though it is individual. I recommend you not to consider the divergences factors when a strong trend occurs, because rollbacks are very small. If someone is intersted in an EA by this indicator, your are welcome, write me a private message or an e-mail.
Translated from Russian by MetaQuotes Ltd.
Original code: https://www.mql5.com/ru/code/8613
 STik
STik
Another indicator that shows the tick chart, it would be useful for the pipsers. It has some features.
 RSIColored_v1, DivPeakTroughRSI_SW
The divergence of RSI, the continuation of the divergence topic.
 Lots Calculation
The calculation of the amount of lots through the specified percentage of free assets.
 Backbone
The EA is based on the permanent variation of the direction of the trades depending on the TakeProfit, StopLoss and TrailingStop levels. It demonstrates how to create a profitable trading system without any indicators, mathematical models and other wisdom
