Watch how to download trading robots for free
Find us on Facebook!
Join our fan page
Join our fan page
You liked the script? Try it in the MetaTrader 5 terminal
- Views:
- 44546
- Rating:
- Published:
- 2008.11.25 08:12
- Updated:
- 2016.11.22 07:32
-
Need a robot or indicator based on this code? Order it on Freelance Go to Freelance
Author:
Chayutra Sriboonruang.
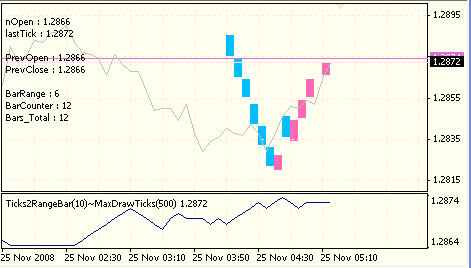
This indicator plots in the chart base on the tick price, ie. when the price moves down 10 pips it plots the down candle and wait till the next 10 pips if move up 10 pips it plots the up candle with the other color candle to indicate the up down price . It only plots when the price range has reached a specific amount of pips that you can specify.

Recommendations:
Attach the indicator on the line chart to see the price up and down candle
 Indicators Based on the MUV Described by Sator
The MUV indicator created by Sator is used.
 MultiZigZag - Another Variant of ZigZag (Economic ZigZag)
This version of ZigZag can simultaneously display three zigzags both drawn on the data from the current timeframe and on the data from the larger timeframes.
 A System: Championship 2008 Revised Edit
Automatic Trading System
 A Sample: Tick counter
Code sample