Join our fan page
- Views:
- 43103
- Rating:
- Published:
- Updated:
-
Need a robot or indicator based on this code? Order it on Freelance Go to Freelance
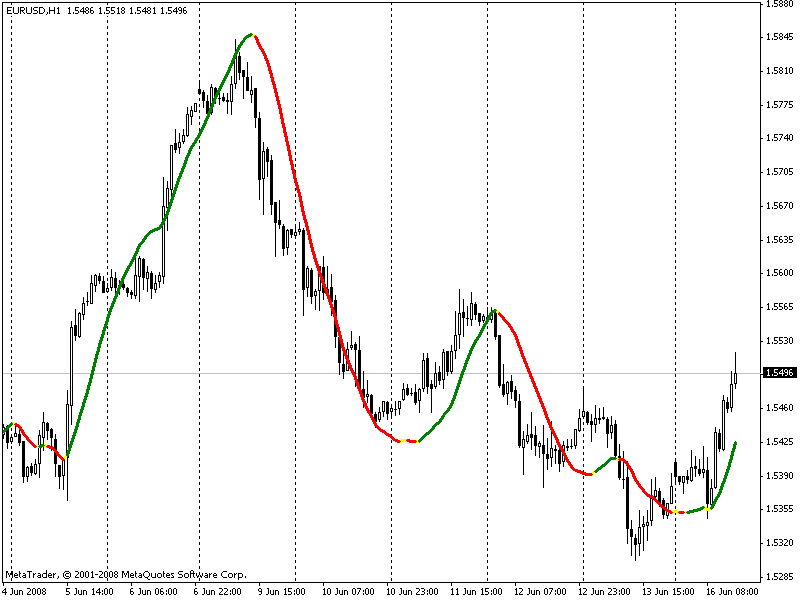
The indicator is completely analogous to indicator LSMA Color published in CodeBase, except only one thing. It works much faster.
Parameters:
extern int period=34; // Regression calculating period
extern int price=0; // Price used for calculations 0-Close, 1-Open, 2- High, 3-Low, etc.
extern int Shift=0; // Chart shift when drawing
extern bool bPlaySound=true; // Playing a sound when changing color
extern string SoundName="alert.wav"; // Wave file
extern int CheckBar=0; // Bar, on which the color changing is controlled

Translated from Russian by MetaQuotes Ltd.
Original code: https://www.mql5.com/ru/code/8200
 Indicator nEMA
TEMA and DEMA are next of kin
 MACDonRSI
The MACD indicator is built on the basis of RSI that, in its turn, is built on MA.
 Waddah Attar Win Expert
Sell when Up >>> Buy when Down
 TrendLineRange
The indicator informs about that the price is approaching to support/resistance line in 3 positions.