Join our fan page
- Views:
- 28010
- Rating:
- Published:
- 2008.06.11 08:00
- Updated:
- 2014.04.21 14:52
-
 You are missing trading opportunities:
- Free trading apps
- Over 8,000 signals for copying
- Economic news for exploring financial markets
Registration Log inYou agree to website policy and terms of use
If you do not have an account, please register -
 Need a robot or indicator based on this code? Order it on Freelance
Go to Freelance
Need a robot or indicator based on this code? Order it on Freelance
Go to Freelance
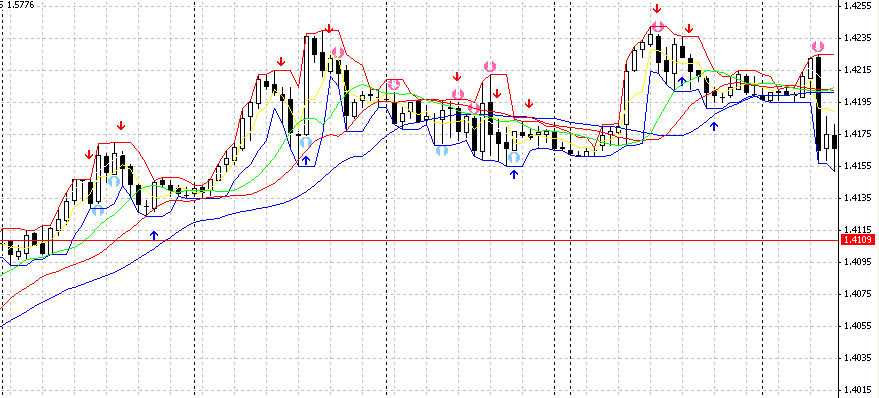
An interesting regularity is observed in the EUR/USD chart. Some time before a reversal, bar appear that have:
1) rate=(High-Low)/MathAbs(Close-Open) remarkably higher than 1
2) Low touches the lower border of the channel (price increasing is possible), or
High touches the upper border of the channel (price decreasing is possible).
Such bars are conventionally called X-points.
The indicator searches for X-points by parameter xrate (rate >= xrate) && (High-Low) >= xsize && (Up-Dn)>= xminupdn.
To filter false signals, the indicator analyzes the bar following the X-point to detect at least small price movement in the predicted direction, and it detects the positions of middle points of bars as related to the mid-channel and to each other.
(See the code of the indicator.)
Parameters:
extern int per=3; - channel building period
extern double xrate=1.5; - minimal rate
extern double xsize=5.0; - minimal bar height (High-Low)
extern double xslope=0.0; - minimal increment of the next bar
extern double xminupdn=10.0; - minimal channel width
extern int xhour1=9; - minimal hour, from which signals are allowed (inclusively)
extern int xhour2=19;- maximal hour, up to which channels are allowed (inclusively)
extern int xindent=15; - signal indent from the chart (it can be used for StopLoss, too)
As you can see from the chart, signals of XPoints (straight arrows) are often ahead of or are more precise than FATL (round arrows).
False signals have not been excluded yet, so you should use additional filtering with other indicators or consider the signals as warnings against too early opening of positions directed oppositely the predicted movement.
Signal filtering by time is added. By default, new signals are ignored.
During tests, another interesting peculiarity of the 'indent' parameter has been found: this parameter can be used for the accurate calculation of opening time, for example, you can open short positions when the price is above the arrow, and vice versa. This approaches the opening to the local extremum point.
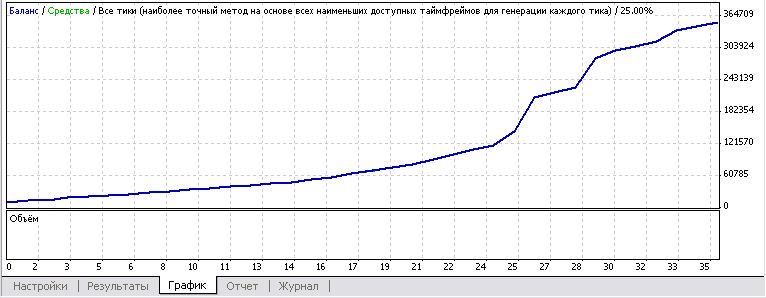
Above is the graph of an Expert Advisor based on the indicator under the conditions of modeling the ATC'2007.
The Ea increased the capital by 35 times within three months using some special methods of aggressive refinancing with the maximal drawdown of 22%.
Translated from Russian by MetaQuotes Ltd.
Original code: https://www.mql5.com/ru/code/8184
 Stochastic_Cross_Alert_SigOverlayM_cw
The indicator displays signals to buy/sell.
 STRATEGY REPORT INTO CHART
Drawing all results from a strategy tester report file into a chart.