Join our fan page
- Views:
- 34564
- Rating:
- Published:
- 2005.11.29 11:51
- Updated:
- 2016.11.22 07:32
-
Need a robot or indicator based on this code? Order it on Freelance Go to Freelance
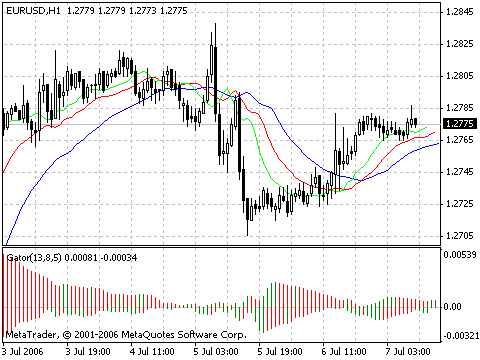
In principle, Alligator Technical Indicator is a combination of Balance Lines (Moving Averages) that use fractal geometry and nonlinear dynamics.
-
The blue line (Alligator’s Jaw) is the Balance Line for the timeframe that was used to build the chart (13-period Smoothed Moving Average,
moved into the future by 8 bars); -
The red line (Alligator’s Teeth) is the Balance Line for the value timeframe of one level lower (8-period Smoothed Moving Average, moved by 5 bars into the future);
-
The green line (Alligator’s Lips) is the Balance Line for the value timeframe, one more level lower (5-period Smoothed Moving Average, moved by 3 bars into the future).
Lips, Teeth and Jaw of the Alligator show the interaction of different time periods. As clear trends can be seen only 15 to 30 per cent of the time, it is essential to follow them and refrainfrom working on markets that fluctuate only within certain price periods.
When the Jaw, the Teeth and the Lips are closed or intertwined, it means the Alligator is going to sleep or is asleep already. As it sleeps, it gets hungrier and hungrier — the longer it will sleep, the hungrier it will wake up. The first thing it does after it wakes up is to open its mouth and yawn. Then the smell of food comes to its nostrils: flesh of a bull or flesh of a bear, and the Alligator starts to hunt it. Having eaten enough to feel quite full, the Alligator starts to lose the interest to the food/price (Balance Lines join together) — this is the time to fix the profit.

Technical Indicator Description
Full description of Alligator is available in the Technical analysis: Alligator
Translated from Russian by MetaQuotes Ltd.
Original code: https://www.mql5.com/ru/code/7803
 Accumulation Distribution
Accumulation/Distribution Indicator is determined by the changes in price and volume.
 Accelerator Oscillator (AC)
Acceleration/Deceleration Indicator (AC) measures acceleration and deceleration of the current driving force.
 Average True Range, ATR
Average True Range Indicator (ATR) is an indicator that shows volatility of the market.
 Awesome Oscillator (AO)
Awesome Oscillator (AO) is a 34-period simple Moving Average, which is subtracted from the 5-period simple Moving Average.