Join our fan page
- Views:
- 11117
- Rating:
- Published:
- 2011.12.27 08:08
- Updated:
- 2016.11.22 07:32
-
Need a robot or indicator based on this code? Order it on Freelance Go to Freelance
This script allows to create a binary *.hst file, supported by MetaTrader 4. This file can be imported in MetaTrader 4 as historical data or you can open it as offline chart.
It has only one DATA_COUNT input parameter, which specifies data count in bars, starting from current.
Initially, this script was designed for checking of the indicators, written in MQL4 and MQL5, because the same data needed for the compare.
To check the indicator values, follow these steps:
1. Install indicators "Zerolag MACD":
MetaTrader 4: - https://www.mql5.com/ru/code/9993
MetaTrader 5: - https://www.mql5.com/en/code/170
2. Install this script in MetaTrader 5 and launch it.
3. If successful, it will print a message with path of the file created, for example:
2011.12.26 20:23:27 SaveHistoryToHST (EURUSD,M1) Path to file: C:\Program Files\MetaTrader 5\MQL5\Files\!EURUSD1.hst
Copy this file to MetaTrader 4 client terminal folder: <MetaTrader 4 Folder>\history\<Server type>\, for example:
C:\Program Files (x86)\MetaTrader 4\history\Alpari-Micro3\
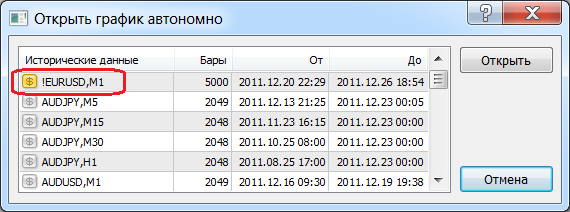
Import file with the history to MetaTrader 4 client terminal as offline, by choosing File -> Open Offlie.

4. Launch the indicator on the MetaTrader 4 offline chart and launch it in MetaTrader 5, you will see that both of them have the same values.

And at last check them visually.
Translated from Russian by MetaQuotes Ltd.
Original code: https://www.mql5.com/ru/code/780
 IncAMAOnArray
CAMAOnArray class is designed for calculation of AMA (Adaptive Moving Average) values on indicator buffers. The example of use of the class is provided.
 TrendLineAlert
The indicator displays the inclined trend line that sets the signal actuating level.
 Laguerre_HTF_Signal
Laguerre_HTF_Signal shows a trend direction or a signal for performing a deal generated by Laguerre indicator as a graphic object with colored trend indication or deal direction.
 WiOver
The indicator shows the average percentage value of the last candlesticks overlap. It is useful for those, who enters the market manually using limit orders during price consolidation, as it allows to select order direction. Blue line - recommended BUY-LIMIT, red one - SELL-LIMIT.
