Join our fan page
- Views:
- 55984
- Rating:
- Published:
- 2007.07.31 08:35
- Updated:
- 2014.04.21 14:51
-
Need a robot or indicator based on this code? Order it on Freelance Go to Freelance
In his book “Mastering Elliot Wave”, Glenn Neely described a new approach to Elliot wave analysis. This technique is known as Neely Method and it is a more objective approach to market wave analysis.
The basic unit in this theory is called a Monowave and it is simply the movement of the price until it changes direction. Monowaves can be identified by plotting the high and low prices for a chosen period according to the order of appearance on beginning and the center of the time slot.

There are many levels for this concept and they have different names such as: Monowave, PolyWave, Multiwave, and Macrowave.
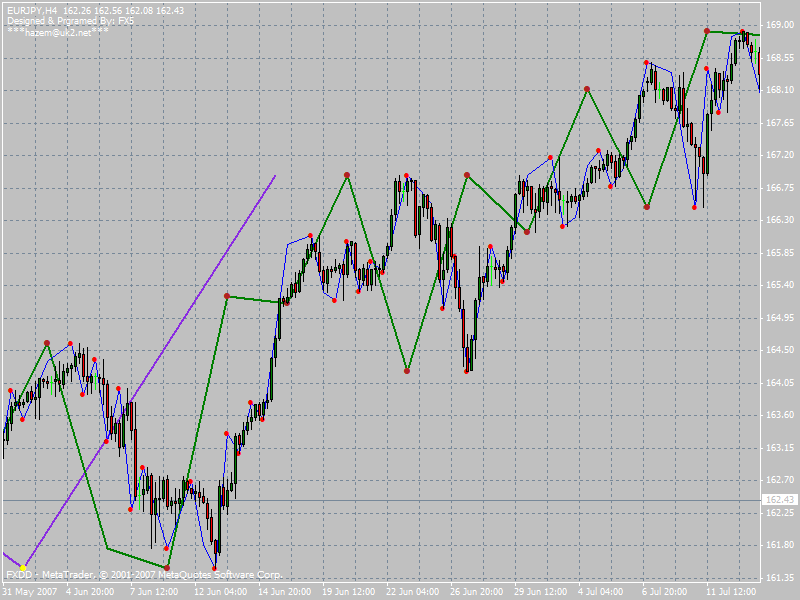
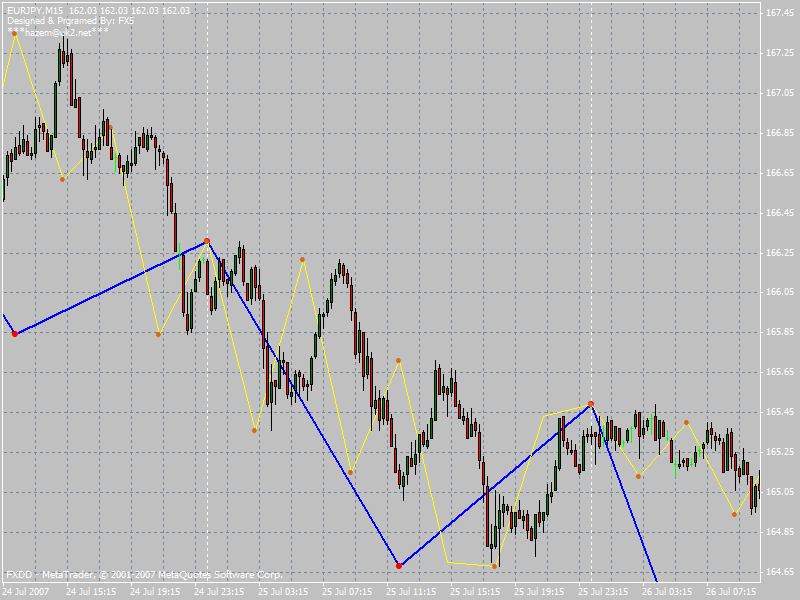
The indicator plots various levels of Monowaves on the various timeframes. The beginning and the ending of each monowave is marked by a dot or a small circle. There are four level plotted in four colors:
- Monthly (default color BlueViolet).
- Weekly (default color Green).
- Daily (default color Blue).
- Quarter Daily (default color Yellow).
All the colors can be changed through the indicator’s settings.

I hope this indicator proof to be a useful tool.
Good Luck.
 Waddah Attar ADXxBollinger Indicator
This is very simple, power and easy to use Indicator
 FXA0 - RSI Crossing 50 plus ATR ver1.2.mq4
This indicator is based on the Jamie Saettele Going Beyond 70 and 30 system. Basically RSI crosses and ATR for entry.
 i-FractalsEx
Fractals indicator with the custom period feature
 e-TurboFx
Do you see 3 bearish and consecutive lengthening bars? Bears - goodbye!