Join our fan page
- Views:
- 50851
- Rating:
- Published:
- 2008.06.16 08:18
- Updated:
- 2016.03.08 11:25
-
Need a robot or indicator based on this code? Order it on Freelance Go to Freelance
Indicator Price and Volume Trend (PVT), like On Balance Volume (OBV), represents the cumulative sum of trade volumes calculated considering close price changes.
The calculation algorithm is close to that of the indicator OBV. But in OBV we add the whole daily volume to the current indicator value when close prices are higher, and detract the whole volume when close prices are lower, while in PVT we add or detract just a part of daily volume. The exact part of the volume to be added to PVT is determined by the value of price change relatively to the close price of the previous day.
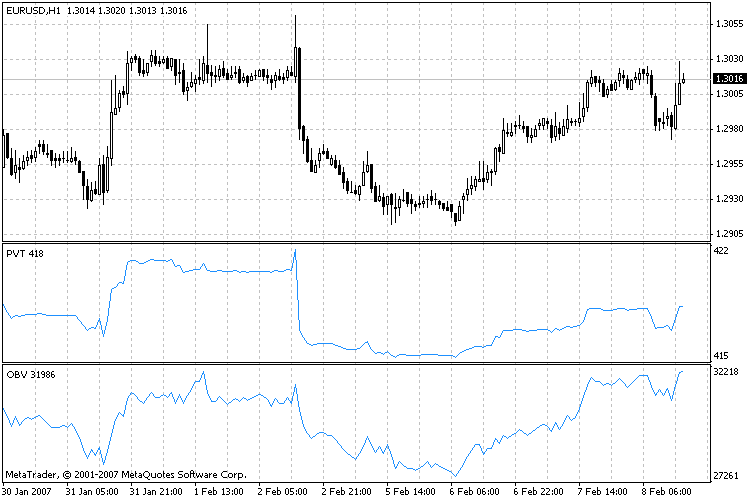
In OBV, the cumulative total volumes for each period are summed. However, in PVT, the volume is multiplied by the coefficient that depends on the difference between the current close price and the previous one. The picture below shows that the behaviors of both indicators are quite correlated:

Translated from Russian by MetaQuotes Ltd.
Original code: https://www.mql5.com/ru/code/7061
 MacdPatternTraderv01. +300 points monthly
A 4-hour MACD FOREX strategy
 Kloss_
Previously uploaded Expert Advisor Kloss specially revised for optimization
 MVV_LinearRegression
The standard linear regression channel and support/resistance levels.
 gpfTCPivotStop
TS on the break through of daily resistance/support levels of the Pivot indicator.