Join our fan page

Spreads - indicator for MetaTrader 5

из интервью: преимущество частного трейдера в том, что можно торговать не всё подряд, потому что надо, но торговать явники.... "в виду явного" движа-парижа, когда что-то происходит!!!
Убыток – это просто незакрытая прибыль с отрицательным знаком ), плата за игру.
- Views:
- 4319
- Rating:
- Published:
-
 You are missing trading opportunities:
- Free trading apps
- Over 8,000 signals for copying
- Economic news for exploring financial markets
Registration Log inYou agree to website policy and terms of use
If you do not have an account, please register -
 Need a robot or indicator based on this code? Order it on Freelance
Go to Freelance
Need a robot or indicator based on this code? Order it on Freelance
Go to Freelance
Spread is realised through the difference of quotes of two symbols. If symbols quotes move in reverse - the second symbol is put in reverse. In this case the spread is calculated through the sum of quotes.
Only quotes of the second symbol of the spread are put in reverse. The names of variables are clear in meaning. It is obligatory to use the indicator when both symbols of the spread are traded - quoted according to the time of the beginning - end of trading sessions.
Use of the indicator is possible when spread trading: for flat trading - increased - sell, decreased - buy. Variability in interpretation of indicator values is also possible. It is possible to trade
lines - support and resistance levels and sloping lines from the spread chart after crossing them.
The code is commented out in detail, to set the indicator on the first symbol of the spread, variables are used to bring to integers for easy viewing and analysis of levels and values of the indicator,
in which we specify the number of decimal places as a multiplier, for example, if 5 decimal places are quoted, we set the value to 100000.
Coefficient_to_an_integer1 = 100000;
Coefficient_to_an_integer2 = 100000;
input double Weighting_coefficients1 = 1;         // proportionality factor (position volume) of the first spread symbol
input int Coefficient_to_an_integer1 = 100000;    // number of quotation marks Sym 1
input string Symbol2 = "USDCAD";                  //second spread symbol
input bool   Symbol2_Reverse = true;              //inverse correlation
input double Weighting_coefficients2 = 1;         // proportionality factor (position volume) of the first spread symbol
input int Coefficient_to_an_integer2 = 100000;   // number of quotation marks Sym 2
In fact, you can use many interpretations of the indicator values and breakdowns and bounces from levels for example - the variability is available, you can look and choose the most ideologically suitable variant for you.
suitable variant.
For example, you can use the trend interpretation of the spread quotes movement, for example, by seasonality.
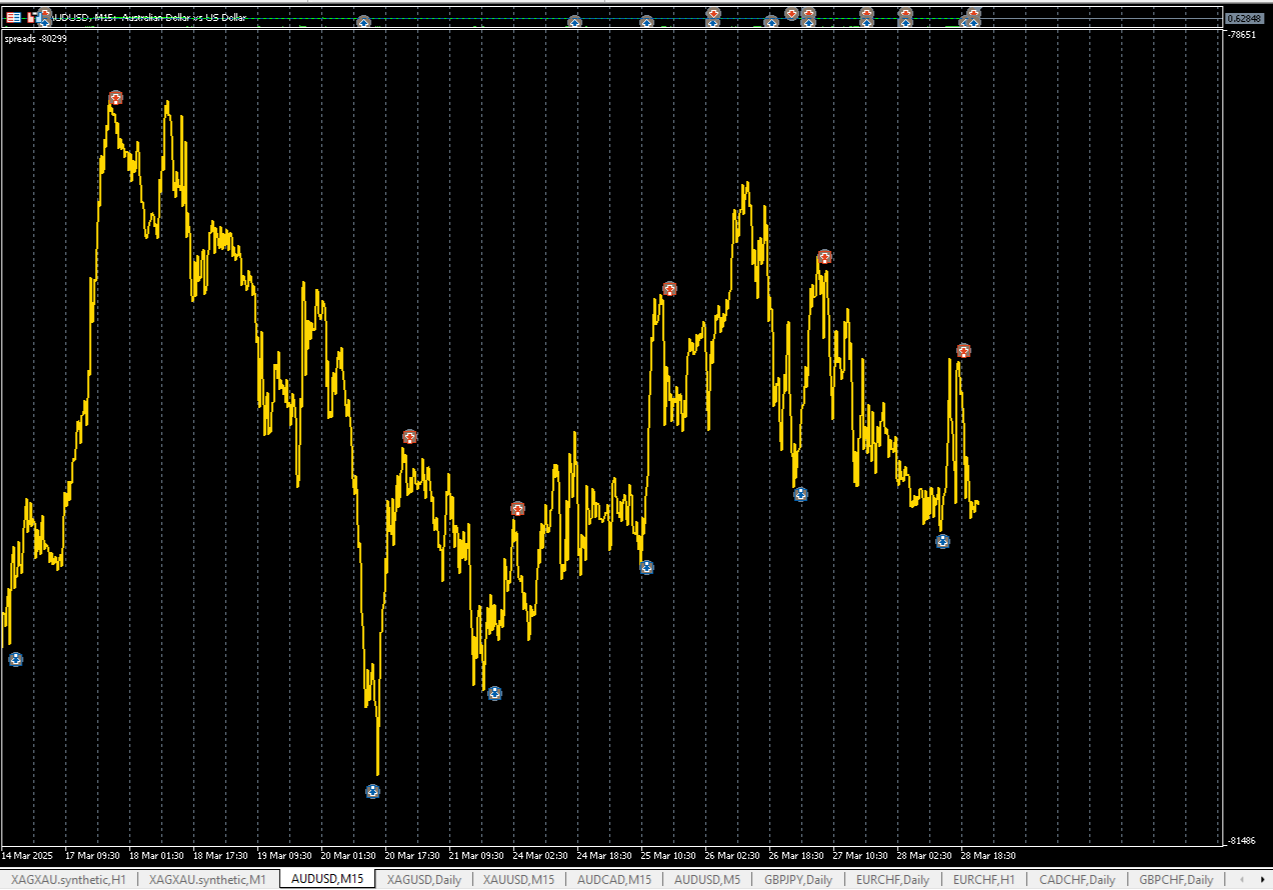
An example of using the classical interpretation of AUDUSD-USDCAD spread, trading in the range. It is also possible to overlay standard figures of technical analysis and technical indicators, for example, envelopes, on the spread chart for a clearer interpretation of its values.
Translated from Russian by MetaQuotes Ltd.
Original code: https://www.mql5.com/ru/code/57620
AveragePrice
Indicator for calculating the average price of open positions, you can use the magic number if you want to separate the positions of just one robot, but the zero number is for manual operations.
Better volume
Better Volume is an advanced indicator designed to analyse the behaviour of volume on price charts. It combines volume information with metrics such as candlestick range and moving averages to identify important patterns in the market, such as buy/sell climaxes, churn and weak candles. With its dynamic visual interface and volume categorisation, the indicator offers valuable insights for traders who want to make informed decisions based on volume flow.
MACD Divergence
MACD Divergence indicator
Countdown 2.0
Countdown is an advanced indicator designed for traders who want to track the time remaining until the next candlestick or the next market open clearly and efficiently. With three flexible display modes (commentary, chart borders or next to price), this indicator offers a customisable solution to suit your trading needs.