Join our fan page
- Views:
- 47918
- Rating:
- Published:
- 2010.01.26 11:28
- Updated:
- 2016.11.22 07:32
-
Need a robot or indicator based on this code? Order it on Freelance Go to Freelance
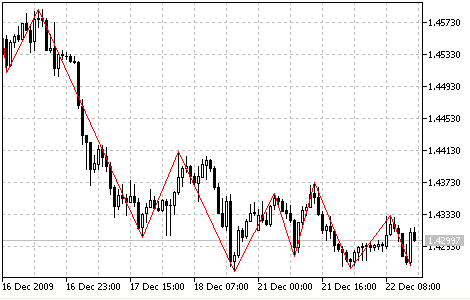
The Zigzag indicator is a series of section lines connecting significant tops and bottoms at the price plot.
Minimum price change parameter determines the percentage for the price to move in order to form a new "Zig" or "Zag" line. This indicator eliminates those changes on the plot we analyze that are less than the given value. Therefore, the Zigzag reflects significant changes only.
In most cases, we use Zigzag to facilitate the perception of plots as it shows only the most important changes and turns. You can also reveal Elliot Waves and various figures on the plot with its aid.

It is important to understand that the last section of the indicator may vary depending on the changes of data you analyze. This is one of those indicators, where a change of securities price can provoke a change of the previous value. This ability to correct its values by the following price changes makes Zigzag a perfect tool for analyzing price changes that have already happened. Therefore, you should not try to create a trade system basing on the Zigzag. It is more suitable for analyzing historical data than for making prognoses.
Translated from Russian by MetaQuotes Ltd.
Original code: https://www.mql5.com/ru/code/56
 Williams’ Percent Range (%R)
The Williams’ Percent Range Indicator (%R) is dynamic technical indicator, which determines whether the market is overbought/oversold.
 Williams'Accumulation/Distribution (W_A/D)
The Williams' A/D indicator is the accumulated sum of positive "accumulational" and negative "distributional" price movements. Divergences between the indicator and the price are a signals.
 ZigZagColor
This is a modified version of ZigZag indicator that draws lines with different colors depending on the price movement direction.
 Bulls Power
The Bulls Power Indicator measures the balance of the bulls strength.