Join our fan page
- Views:
- 1347
- Published:
- 2025.01.30 05:23
- Updated:
- 2025.01.30 05:24
-
 You are missing trading opportunities:
- Free trading apps
- Over 8,000 signals for copying
- Economic news for exploring financial markets
Registration Log inYou agree to website policy and terms of use
If you do not have an account, please register -
 Need a robot or indicator based on this code? Order it on Freelance
Go to Freelance
Need a robot or indicator based on this code? Order it on Freelance
Go to Freelance
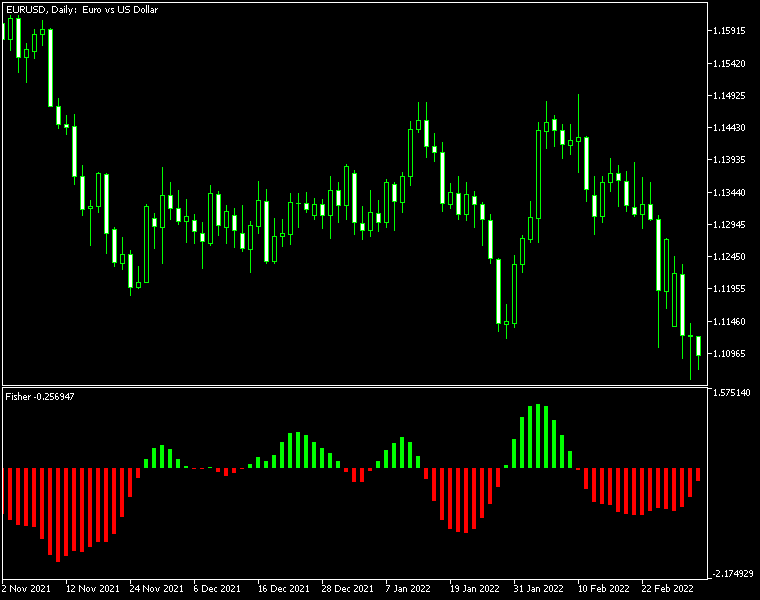
Fisher MetaTrader indicator — is quite a simple histogram indicator that detects the trend's direction and strength and signals about trend changes. It doesn't use any standard MT4/MT5 indicators in its code. Fisher bases its calculations on the maximum and minimum price levels from the previous periods, applying some advanced math calculations to the relations between the current price and the max/min prices. The indicator is available for both MT4 and MT5. This is a "repainting" indicator — it recalculates previous bars when a new bar arrives.
Input parameters
- Period (default = 10) — the period in bars, on which to calculate the maximum and minimum. The higher is the value the fewer false trend change signals occur but the more this indicator lags.
 Easy Trend Visualizer MT4
Easy Trend Visualizer is a MetaTrader indicator that does exactly what its name says. It shows where the trend begins, where it ends, and where there is no trend at all. It is based on standard MetaTrader ADX (Average Direction Movement Index) indicators and works quite fast. Easy Trend Visualizer displays itself in the main chart window. It offers a range of alerts: horizontal line appears, horizontal line cross, arrow up, arrow down, previous horizontal line cross (PHLC). Available for MT4 and MT5 platforms
Dots Indi MT4
Dots (MetaTrader indicator) is based on the 2006 indicator by TrendLaboratory. It displays the current trend direction by placing the dots on the main chart. The blue dots signal bullish trend and the red dots signal bearish trend. Although the indicator doesn't rely on any standard MetaTrader indicators, it uses a call to iMA() (moving average) to get the price values depending on the input price type used (Close, Open, High, Low, Typical, etc.) The calculation is based on the cosine of the angle of price change. Trader can modify several input parameters. The indicator is available both for MT4 and MT5 versions of the platform.
Float MT4
Float MetaTrader indicator — a sophisticated indicator that analyzes the previous chart history for the given currency pair and then tries to analyze the trends in the current situation. It shows where trends start and end in a separate chart window and Fibonacci retracement levels combined with DiNapoli levels on the main chart. It also displays how long ago the local high and low were detected. This indicator is available for MT4 and MT5.
Gain/Loss Info MT4
Gain/Loss Info MetaTrader indicator — displays the gains and losses for all candles where the given threshold is surpassed. The values are calculated in points and percentage. The indicator can calculate gain/loss in two modes: plain candlestick Close and Open difference, and as difference between current Close and previous Close. You can set minimum change limits (for pips and percentage), change modes, and you can also control font color of the output numbers. The indicator is available for both MT4 and MT5