Join our fan page
- Views:
- 698
- Published:
- 2025.01.30 03:48
-
 You are missing trading opportunities:
- Free trading apps
- Over 8,000 signals for copying
- Economic news for exploring financial markets
Registration Log inYou agree to website policy and terms of use
If you do not have an account, please register -
 Need a robot or indicator based on this code? Order it on Freelance
Go to Freelance
Need a robot or indicator based on this code? Order it on Freelance
Go to Freelance
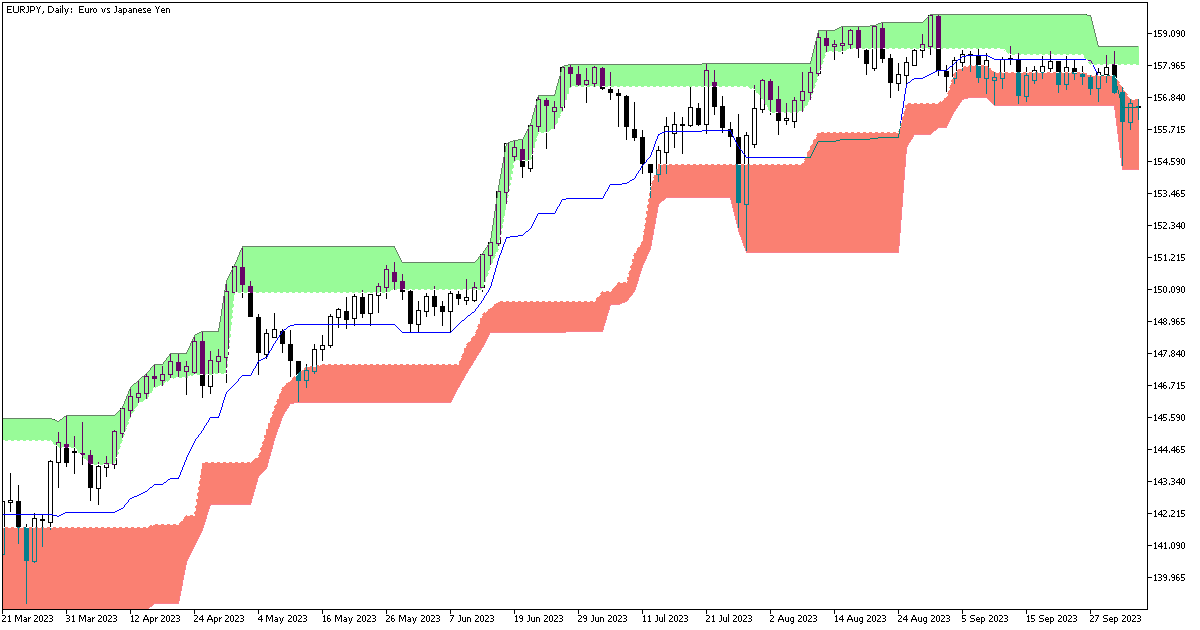
Donchian Ultimate MetaTrader indicator — is a classic Donchian channel indicator with multiple features added:
- Variable period and shift of the Donchian channel.
- The middle line that can be turned off.
- Support for multi-timeframe (MTF) operation.
- 5 different calculation methods for the channel borders.
- Optional support and resistance zones near the main Donchian channel's borders.
- A comprehensive alert system.
- A high level of customization accord to your trading needs.
The indicator is drawn in the main window and doesn't use any standard or custom indicators in its code. Donchian Ultimate is available for the MT4, MT5, and cTrader trading platforms.
Input parameters
- Period (default = 20) — the Donchian channel period.
- Timeframe (default = Current) — the timeframe to calculate the channel on. If you set it to a timeframe that is higher than the current one, the indicator will display a higher timeframe channel on the current chart. The parameter is ignored if set to a timeframe that is lower than the current one.
- PriceType (default = Highest High (Lowest Low)) — the type of prices to use in calculations. Can be one of the five modes:
- Highest High (Lowest Low) — the classic Donchian channel configuration with the upper band calculated as the Highest High of the period and the lower band calculated as the Lowest Low of the period.
- Average Highest High, Highest Open (Lowest Low, Lowest Open) — the upper band is calculated as the average between the Highest High and the Highest Open of the period and the lower band is calculated as the average between the Lowest Low and the Lowest Open of the period.
- Average Highest High, Highest Close (Lowest Low, Lowest Close) — the upper band is calculated as the average between the Highest High and the Highest Close of the period and the lower band is calculated as the average between the Lowest Low and the Lowest Close of the period.
- Highest Open (Lowest Open) — the upper band is calculated as the Highest Open of the period and the lower band is calculated as the Lowest Open of the period.
- Highest Close (Lowest Close) — the upper band is calculated as the Highest Close of the period and the lower band is calculated as the Lowest Close of the period.
- Shift (default = 0) — the indicator's shift in bars.
- Show Resistance Span (default = true) — if true, the upper resistance span will be displayed on the chart.
- Show Support Span (default = true) — if true, the lower support span will be displayed on the chart.
- Alert Candle (default = Previous) — the candle to issue alerts on: Previous — the most recently closed candle or Current — the yet unfinished candle.
- Alert About Bullish Crossing of Mid Line (default = true) — if true, the indicator will issue alerts when a candle closes crossing the middle line from below.
- Alert About Bearish Crossing of Mid Line (default = true) — if true, the indicator will issue alerts when a candle closes crossing the middle line from above.
- Alert About Candle Close Inside Resistance (default = true) — if true, the indicator will issue alerts when a candle closes inside the resistance zone.
- Alert About Candle Close Inside Support (default = true) — if true, the indicator will issue alerts when a candle closes inside the support zone.
- Show Alert (default = false) — if true, indicator will use MetaTrader's native pop-up alerts.
- Send Email (default = false) — if true, indicator will use MetaTrader's email alerts. Email should be properly configured in MetaTrader via Tools->Options->Email.
- Send Notification (default = false) — if true, indicator will use MetaTrader's push notification alerts. Notifications should be properly configured in MetaTrader via Tools->Options->Notifications.
Example and strategy
As with the classic Donchian channel indicator, Donchian Ultimate cannot be used to generate buy and sell signals on its own. What it can do is demonstrate the current situation with the trend and how close the price is to changing direction or extending the trend. As you can see on the chart below, the upper band rises steadily when a trend starts, while both bands start go sideways when the currency pair is consolidating:
 Daily Percentage Change MT5
Daily Percentage Change (MetaTrader indicator) — calculates the change of currency rate related to the previous daily close and displays it in percentage points in the main chart window of the platform. Additionally, it can display the weekly and monthly percentage changes. Different colors can be set for positive or negative price increases. Also, a small customizable arrow helps to visualize the price change direction. If your broker uses an unconventional time zone, the indicator can use Time Shift parameter to adjust the hour it will use for the day's end. The indicator works equally well in MT4 and MT5.
Detrended Price Oscillator MT5
Detrended Price Oscillator (MetaTrader indicator) — a version of the price oscillator based on the difference between the current price and the simple moving average shifted by (Period / 2) + 1 bars. Unlike the stochastic oscillator, this indicator aims to show the short-term trend changes (price waves inside the long-term trend). The indicator is displayed in the separate window of the chart. You can use this Detrended Price Oscillator (DPO) indicator in both MT4 and MT5 versions of the platform.
Dots Indi MT5
Dots (MetaTrader indicator) is based on the 2006 indicator by TrendLaboratory. It displays the current trend direction by placing the dots on the main chart. The blue dots signal bullish trend and the red dots signal bearish trend. Although the indicator doesn't rely on any standard MetaTrader indicators, it uses a call to iMA() (moving average) to get the price values depending on the input price type used (Close, Open, High, Low, Typical, etc.) The calculation is based on the cosine of the angle of price change. Trader can modify several input parameters. The indicator is available both for MT4 and MT5 versions of the platform.
Easy Trend Visualizer MT5
Easy Trend Visualizer is a MetaTrader indicator that does exactly what its name says. It shows where the trend begins, where it ends, and where there is no trend at all. It is based on standard MetaTrader ADX (Average Direction Movement Index) indicators and works quite fast. Easy Trend Visualizer displays itself in the main chart window. It offers a range of alerts: horizontal line appears, horizontal line cross, arrow up, arrow down, previous horizontal line cross (PHLC). Available for MT4 and MT5 platforms